
You can watch a brief video explaining more using continuous contracts on TradeNavigator.
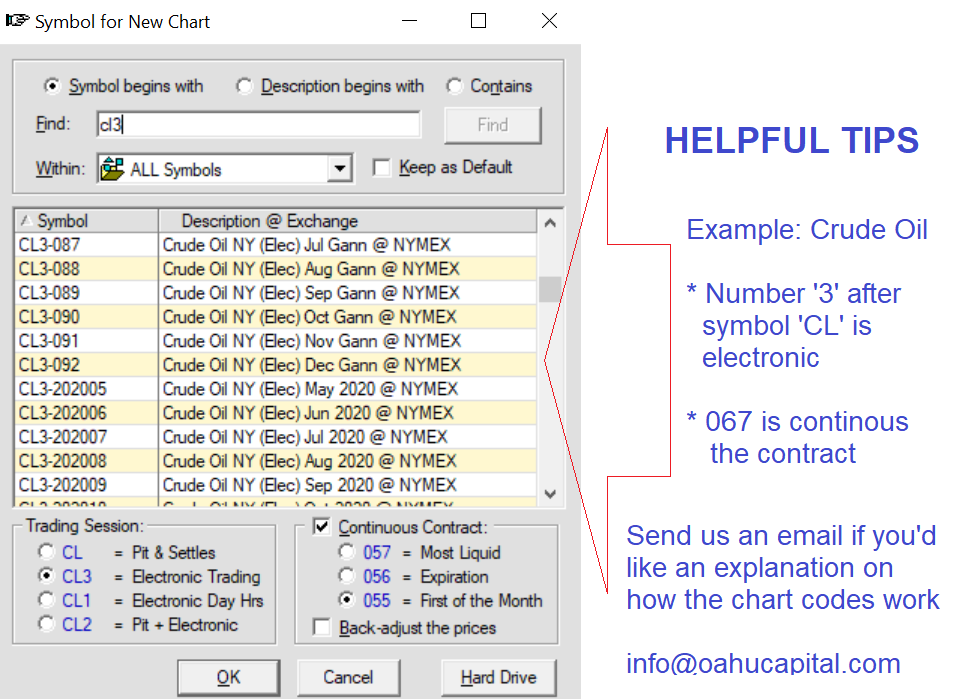
What is a Continuous Contract?
Continuous Contracts are artificial contracts created by combining portions of actual contracts together to get a longer view of commodity patterns. Actual contracts generally have a short life with little activity during the early portion of the contract. Continuous contracts, on the other hand, can be created to look at the most active portions of each contract, end-to-end, going back over many years. This allows you to get a better feel for trends and is helpful in strategy testing. The portions used from each individual contract will vary depending on the type of continuous contract and the particular commodity. See Types of Continuous Contracts for those provided by Genesis and updated by Trade Navigator.
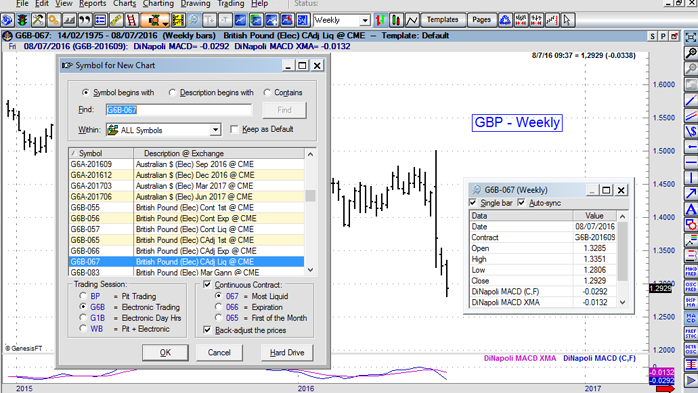
In Trade Navigator, to see which contract is the current front month for a continuous contract, place your crosshairs (or cursor) on the last bar showing in the continuous contract chart. Look in the gray area just above the chart (with your cursor still on the last bar). The current front month contract will be displayed just to the right of the date in parenthesis. Thu 5/1/03 (BO-200307) would mean that on 5/1/03, July 2003 was the front month for BO.
In Trade Navigator, whenever the mouse pointer is positioned within the graph, the data for that particular day is displayed between the title bar and the top of the graph. The original contract used on the particular date on the graph will be displayed in parentheses next to the date.
* Below is a chart of the British Pound - GBP-067 which is a continuous contract
Roll Date
The roll date is the date when the continuous contract stops pulling its data from one contract and moves on to the next. e.g. a BO-067 takes its data from the May contract until it rolls, at which time it rolls to the July contract if the volume and open interest are greatest for the July contract.
Open Interest/Volume Roll
A dynamic roll method which follows closest to the liquidity of the market. The contract is designed to roll after considering several conditions. The primary condition is when the next contract has greater volume and open interest for two consecutive days than the one currently being used. Additional conditions are used for markets with almost all open interest in only two contracts, markets that are extremely regular in their roll date, and markets that tend to roll very close to expiration. When the conditions are met the contract rolls to the next contract. Roll dates will vary. This is the most popular method amongst our customers and is the basis for our 057 and 067 contracts.
Gann Contracts
Gann contracts are artificially created contracts created by combining actual contracts together. These contracts roll from calendar month to same calendar month. For example: March 98 rolls into March 99 and so on. These contracts roll on the expiration date and have no price adjustment. Contracts are labeled from 081 through 092. To determine the month represented, subtract 80 from the last 2 digits.
For example: 89 - 80 = 9 (September), 83 is March and 92 is December.
Spot Month or Contract
The contract currently closest to expiration.
Back Adjusting
When a continuous contract rolls from one contract to another, there is usually a difference in price between the two contracts on the roll date. This difference in price can result in a price gap on your chart. Back adjusting takes the difference between the two contract prices and adjusts all previous price points by that difference to remove the gap. The primary advantages of back adjusting are that the graph "smoothes" the transition between contracts so that it does not give false signals due to a sudden change in price and existing trends are retained. Be aware, though, that all prices prior to the most recent roll date are adjusted and not actual.
The 50 series (55's, 56's, 57's) are NOT "Back-Adjusted" -- When the 50's series contracts roll from one contract to the next, they do not factor out the price difference that naturally occurs between where the old contract is currently trading and where the new contract is currently trading. This kind of raw data is designed simply to show the exact prices where that symbol was actually trading on any particular day in history, but is typically NOT used for analysis. The price on the first day of the new contract may be well above the previous day's price and make it "look" like the market went up, when in fact every contract of that market could have been down on the day of the roll. This can fool most indicators into giving false indications for a trade. This is why the 60's series contracts were developed.
The 60 series (65's, 66's, 67's) ARE "Back-Adjusted" -- When they roll from one contract to the next, they do factor out the price difference that naturally occurs between where the old contract is currently trading and where the new contract is currently trading. We do this by calculating the difference between the closing prices of the two contracts at the end of the session immediately prior to rolling to the new contract, and subtracting that from all history prior to the roll.
Back-adjusted data is DESIGNED FOR ANALYSIS purposes. Since the price difference between contracts has been factored out, the back-adjusted transition between the last bar of the old contract and the first bar of the new contract provides a genuine reflection of the market as a whole. Thus the same "patterns" of the OHLC for today compared to yesterday will be reflected in back-adjusted data and most indicators will perform exactly the same on back-adjusted data across the transitions as on the individual contracts.
Types of Continuous Contracts
The following are various types of end-of-day continuous contracts that can be provided by Genesis and automatically updated by Trade Navigator.
055 - Cont 1st - Rolls on first trading day of the expiration month
055s roll from the spot month to the next contract on the first trading day of the expiration month and have no price adjustment.
056 - Cont Exp - Rolls at expiration
056s roll from the spot month to the next contract at expiration and have no price adjustment.
057 - Cont Liq - Rolls based on Volume and Open Interest
057s roll from the spot month to the next contract on a date based upon the Open Interest/Volume roll method and have no price adjustment.
065 - Cadj 1st - Back adjusted, Rolls on first trading day of the expiration month
065s roll from the spot month to the next contract on the first trading day of the expiration month and are back adjusted.
066 - Cadj Exp - Back adjusted, Rolls at expiration
066s roll from the spot month to the next contract at expiration and are back adjusted.
067 - Cadj Liq - Back adjusted, Rolls based on Volume and Open Interest
067s roll from the spot month to the next contract on a date based upon the Open Interest/Volume roll method and are back adjusted.
081 - 092 - Gann Contracts
These contracts roll from calendar month to same calendar month. For example: March 98 rolls into March 99 and so on. Gann contracts roll on the expiration date and have no price adjustment. Contracts are labeled from 081 through 092. To determine the month represented, subtract 80 from the last 2 digits. For example: 89 - 80 = 9 (September), 83 is March and 92 is December.
099 - Cash Contracts
099s are cash contracts and are not artificially created continuous contracts. The price values represent the cash settled price for the market. Cash contracts are not available for all commodities.
The 55's and 65's are designed to roll on the first trading of the month of expiration.
The 56's and 66's are designed to roll upon expiration. This stays with the current contract until it expires, then it rolls to the next contract on the following day.
The 57's and 67's are designed to roll when the new contract becomes more "active" (or liquid) than the old contract.
THE BOTTOM LINE: For most kinds of analysis we highly recommend the "67" continuous contracts (such as the SP-067, TQ-067, W-067) since they are designed to stay with the "active" contract or the contract most likely being traded on any particular day and they are back-adjusted to provide a "corrected" price transition from one contract to the next.
With all of the above said, the software will allow you to submit trades when using continuous contracts on a chart, but the order is submitted against the individual contract month.
Get a Free Guest Pass to download a trial of TradeNavigator software! Oahu Education will waive the $7 set up fee normally assessed on trials and you'll receive a free 1-on-1 training session with support on setting up.

Get a Free Guest Pass to try TradeNavigator for 30 days