Get your copy of Paul Forchione's book, "Trading Iron Condors". Learn techniques from a professional options trader to manage risk while speculating on futures markets.

Click here to view Paul's eBook
By using our website, you agree to accept our terms of use (click to read)
Highlights
- Year to date 15% on the upside
- Positive employment data has little impact
- Tech sector holds after prior session's weakness
- CPI report will be important given weak wages
- On Wed is the FOMC minutes & ECB decision
- Inflation is the focal point where 2900 is a possible push
Volatility
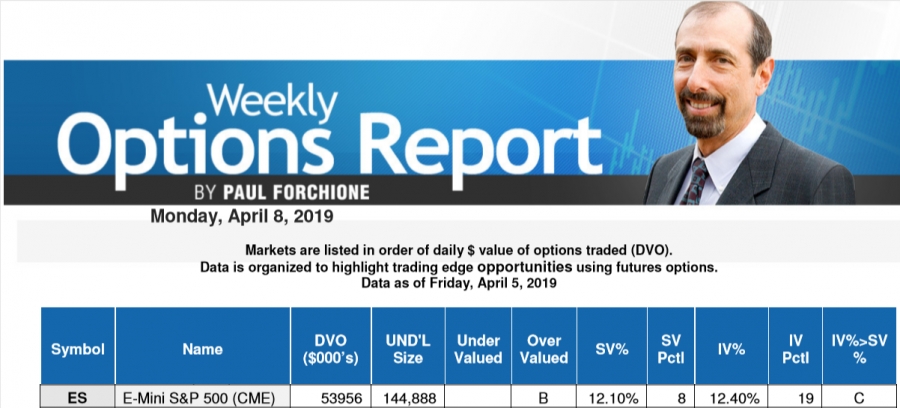
Options fall into the category of being slightly undervalued in non-volatile markets in the weekly options report.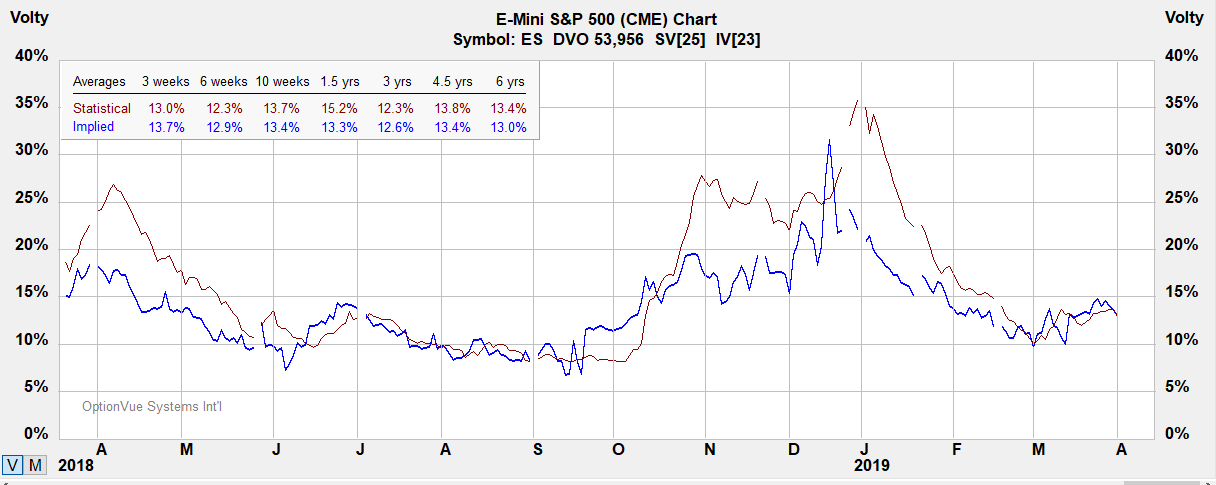
Notes:
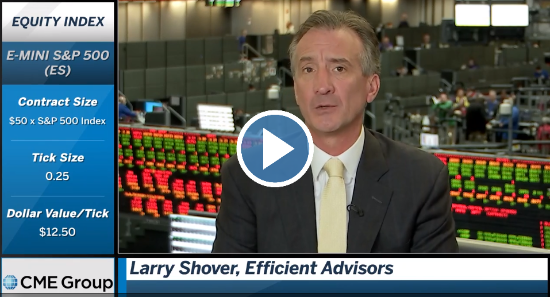
Contract Size - $50 x S&P 500 Index.
Tick Size: Outright: 0.25 index points=$12.50
Trading Hours: CME Globex: Sunday - Friday 6:00 p.m. - 5:00 p.m. Eastern Time (ET) with trading halt 4:15 p.m. - 4:30 p.m.
?ml=1" class="modal_link" data-modal-class-name="no_title">* Tip: Click here to read a helpful tip about E-Mini S&P futures and options
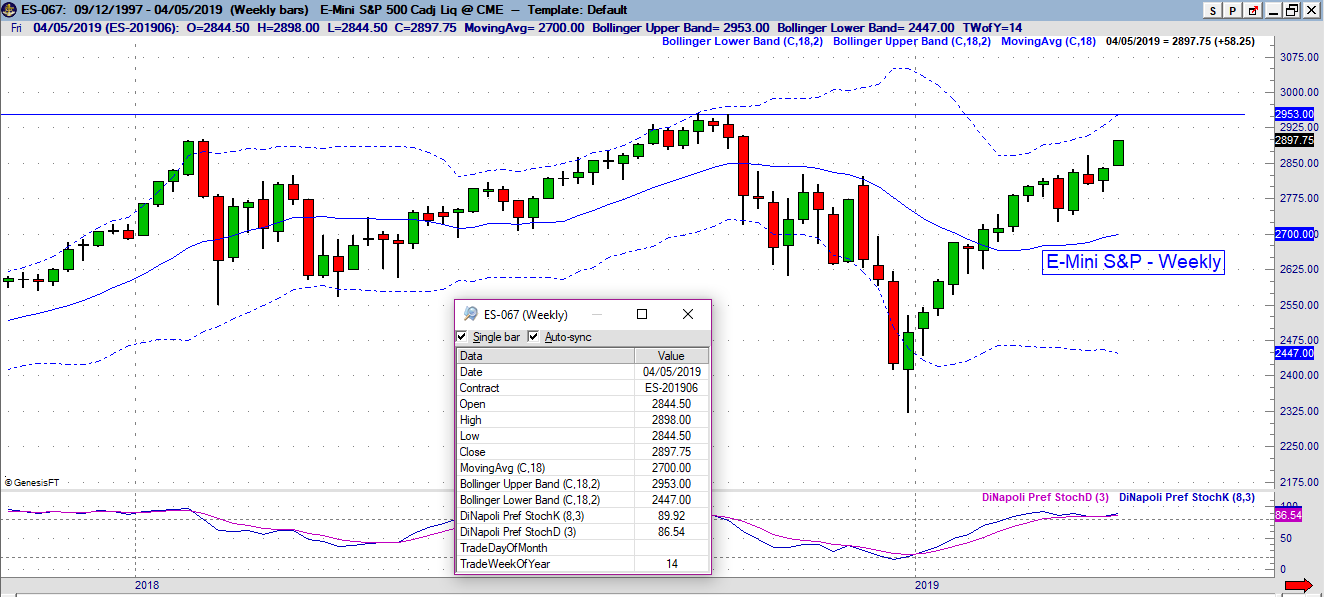
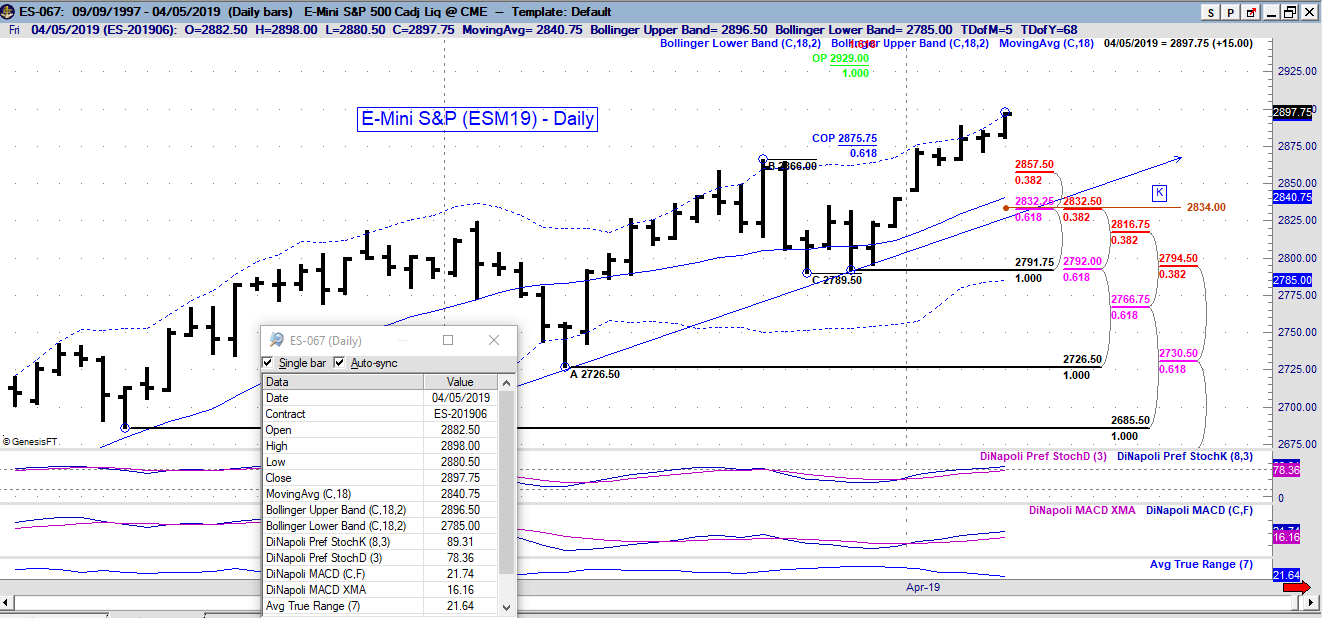
E-Mini S&P
Below are charts for reference.
?ml=1" class="modal_link" data-modal-class-name="no_title">* Tip: Click here on enlarging images
Strategies
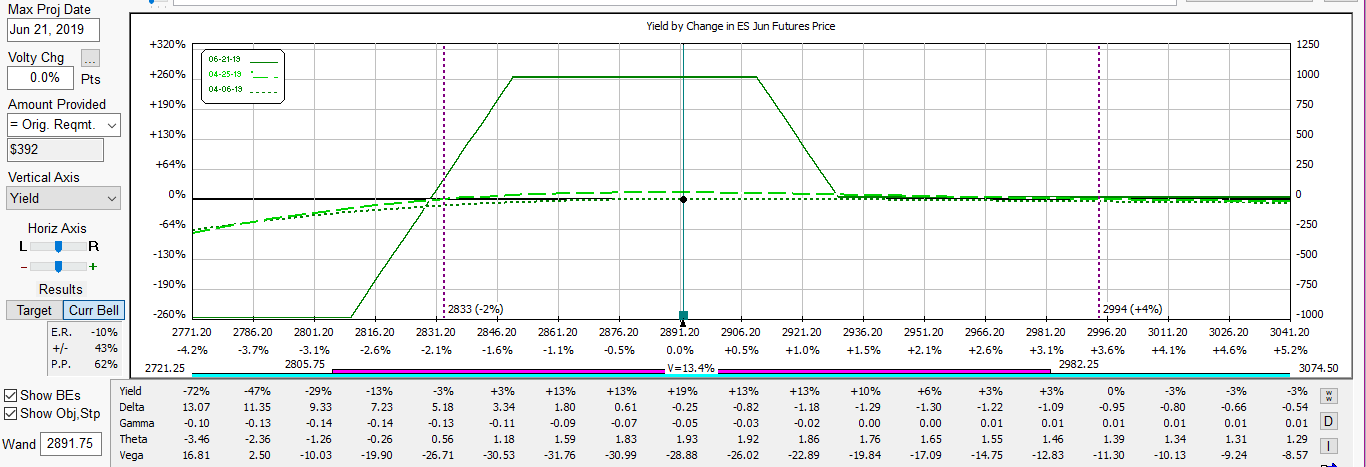
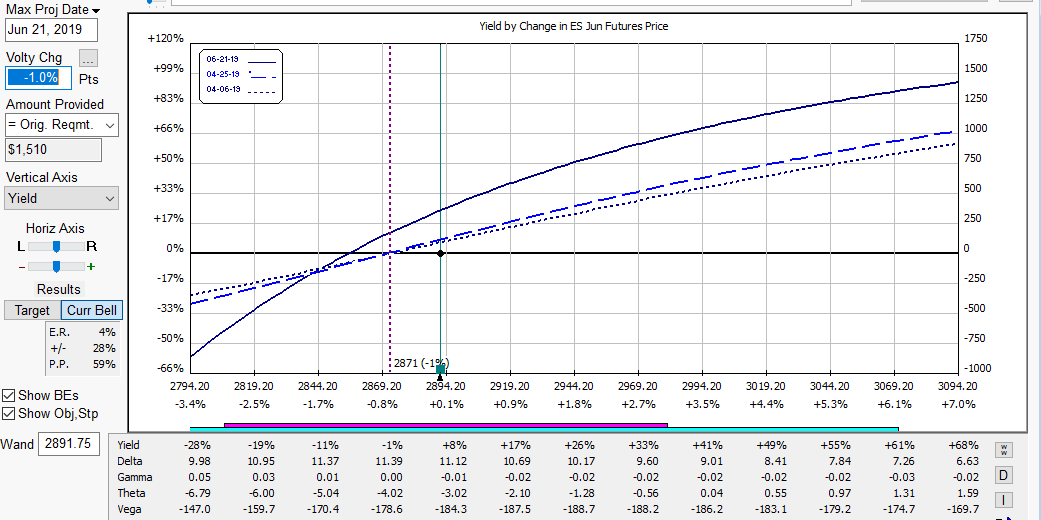
Below is a reverse calendar which falls in line with Paul's weekly report based on looking at implied in relation to statistical volatility levels. The spread is a pure directional play.
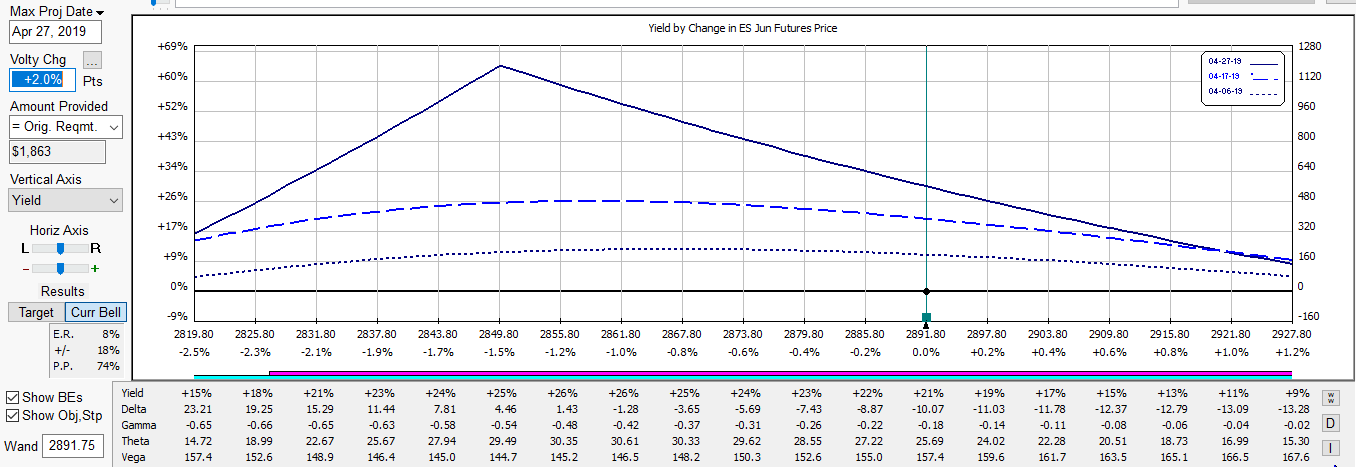
Here's a calendar spread to the downside. It takes into consideration that IV would increase with a sell off in the market and maintains positive Vega. I've modeled a 2 point projected increase in implied volatility if a possible sell off were to occur.
Below is an iron condor with a very flat T+0 line assuming a slight continued rise on markets. If prices fell below 2830 or rose above 2930, the structure would be adjusted. This is a more conservative play than above.