Trade Options on Futures
Crude Oil * Directional & Neutral Positions
Get your copy of Paul Forchione's book, "Credit Spreads". Learn techniques from a professional options trader to manage risk while speculating on futures markets.

Click here to view Paul's eBook
By using our website, you agree to accept our terms of use (click to read)
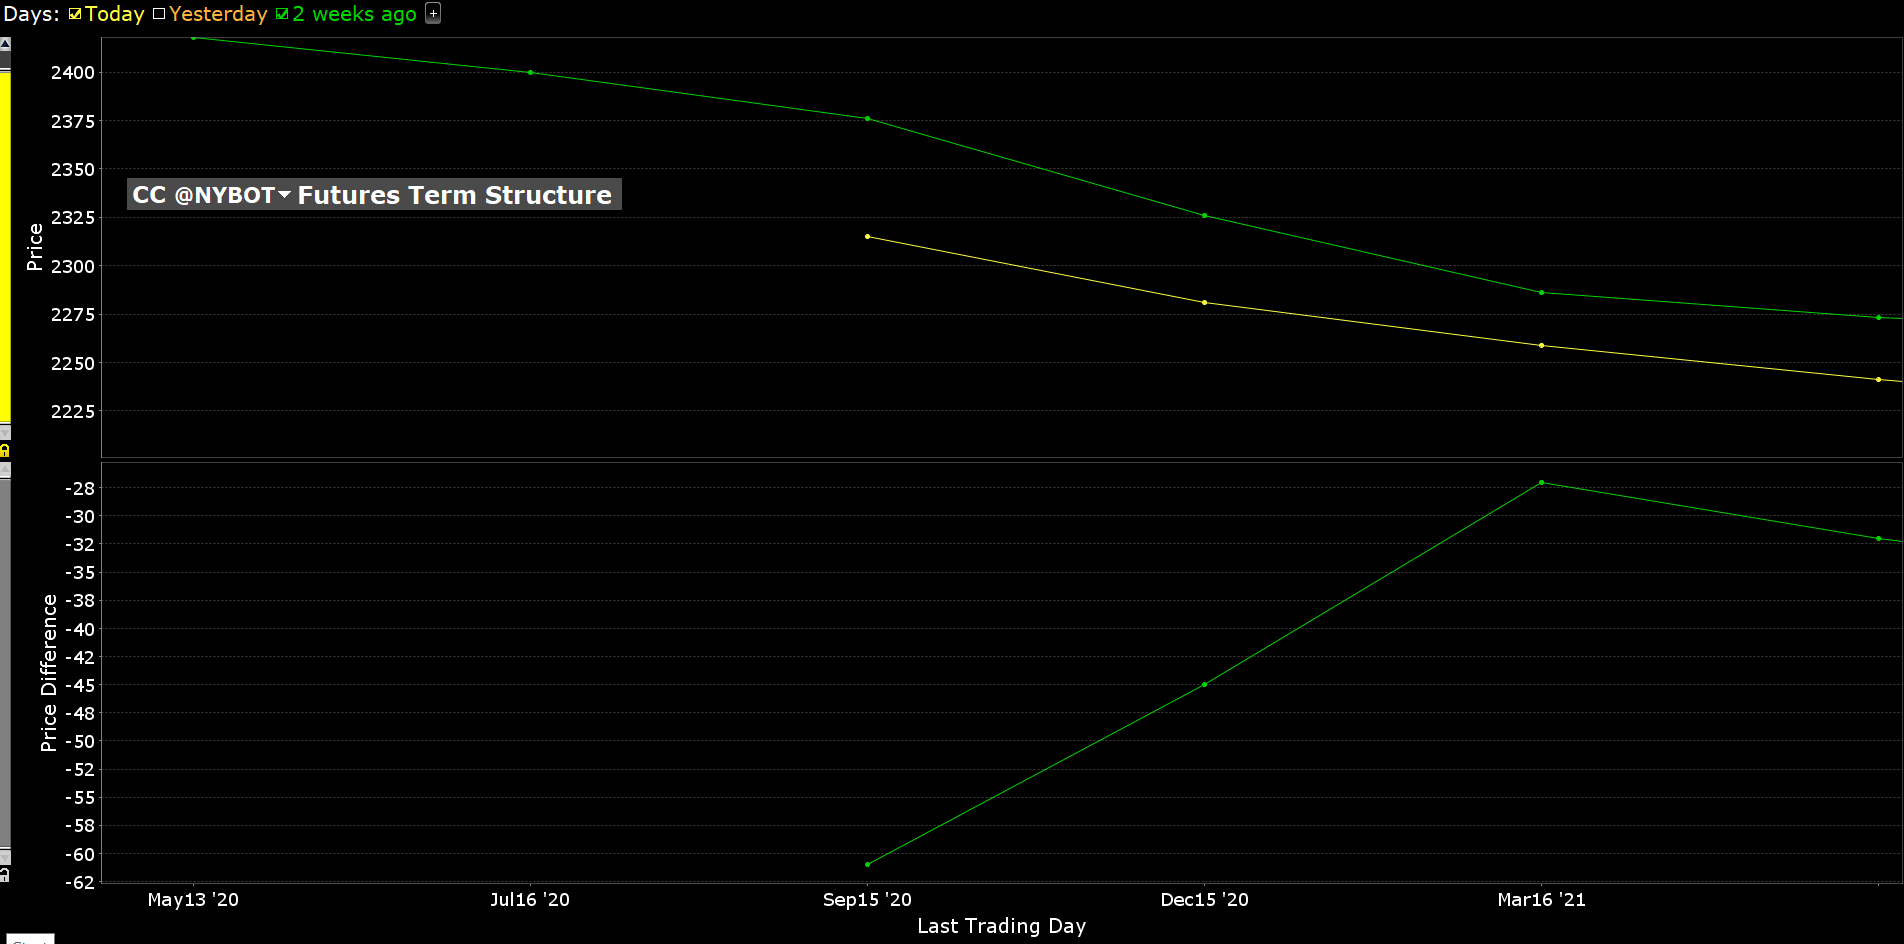
Term Structure
Commentary
The Cocoa Craving (Straits Financial, May 18, 2020)
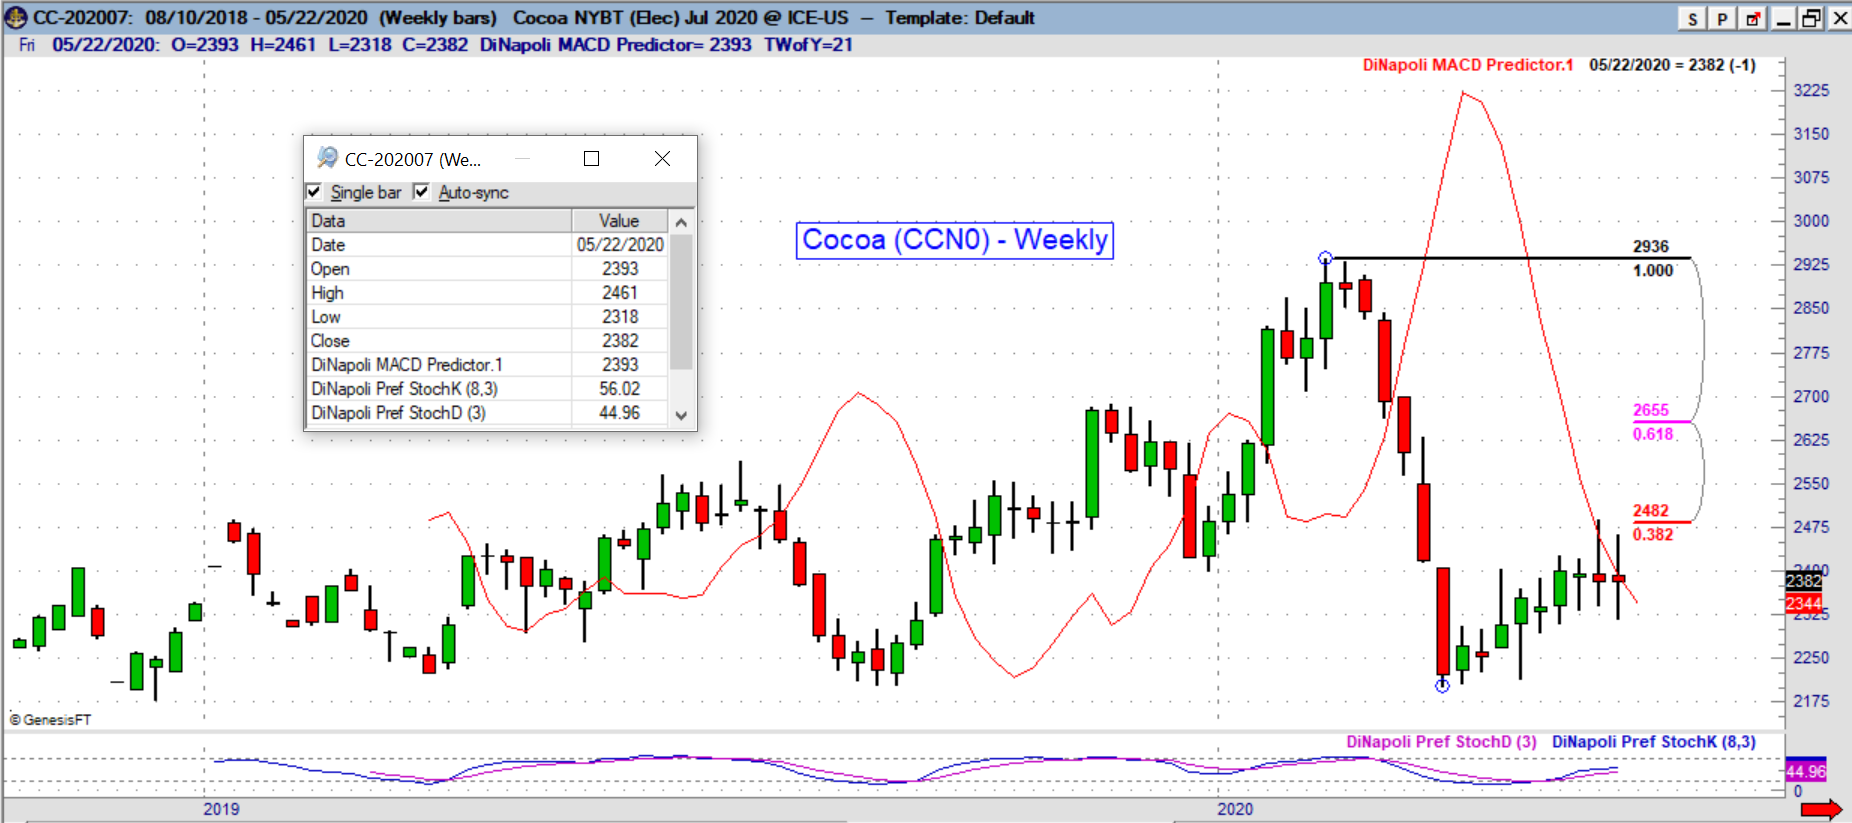
The steep decline in the price of cocoa coincides with the escalation in the spread of COVID-19. The cocoa market had been maintaining trade around the 2800-2900 region before seeing a steep slide that has since taken prices as low as 2200.
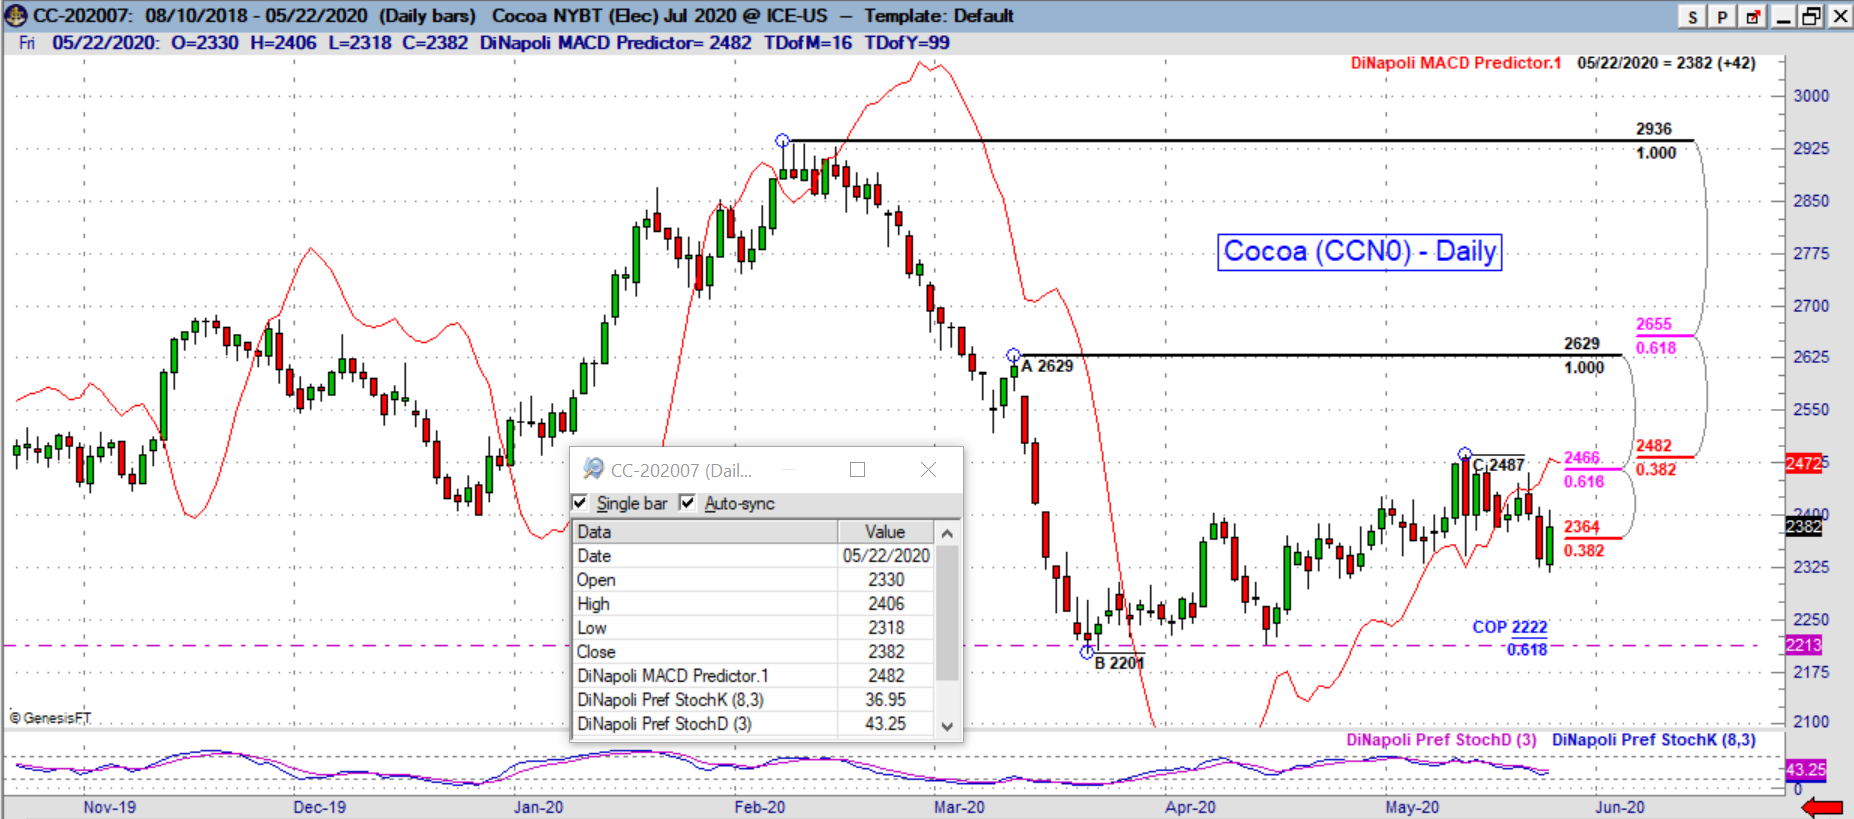
After making a bottom in mid-March around the 2200 level, the market has been trying to rebound, but a lack of overall demand may keep prices under pressure for the foreseeable future. Since mid-April, the market has made a series of higher lows, and recent price action saw the market breakout clearly above the 2400 level.
Declining demand due to the closure of retailers is likely the major catalyst for weaker cocoa prices. Grinding in Europe, for example, may see a 3% decline from the previous year. The North American region could see a drop of 5.3%, while Asian processing could fall by 9%.
The ongoing pandemic could fuel a further decline in consumer spending, and demand for chocolate is likely to fall further as prices rise and as the economic impact of the virus becomes clearer. The decline in disposable income for luxury goods may erode not only chocolate demand but also demand for similar products in the months and quarters ahead and could keep the cocoa market under some pressure.
If demand for cocoa-related products, such as chocolate, is under pressure, what might be fueling the recent rise in cocoa to a two-month high? The answer is supply and fear of a shrinkage in supply. Although the coronavirus pandemic has led to a decline in product demand, it is also making shipping and transportation far more challenging than normal. Ghana, for example, is the world’s second-largest cocoa producer. It is also, however, the African leader in cases of the virus.
In addition to the ongoing COVID-19 pandemic, the cocoa supply situation may also be considered bearish and could potentially put a cap on any rise in price. Inventories are reportedly at a 9.5-month high of nearly 4.5 million bags as of May 1st. That figure is quite a bit higher than last December’s multi-year low of almost 2.7 million bags.
The market will have its way, however, and recent price action has painted a more bullish picture compared to previous weeks. The bulls could potentially have enough in the tank to take price for a test of the 2600 region. Beyond that level, a run towards 2800 may become increasingly likely.
Unless a significant change is seen in the virus pandemic, however, any rallies in cocoa should be viewed with a degree of skepticism.
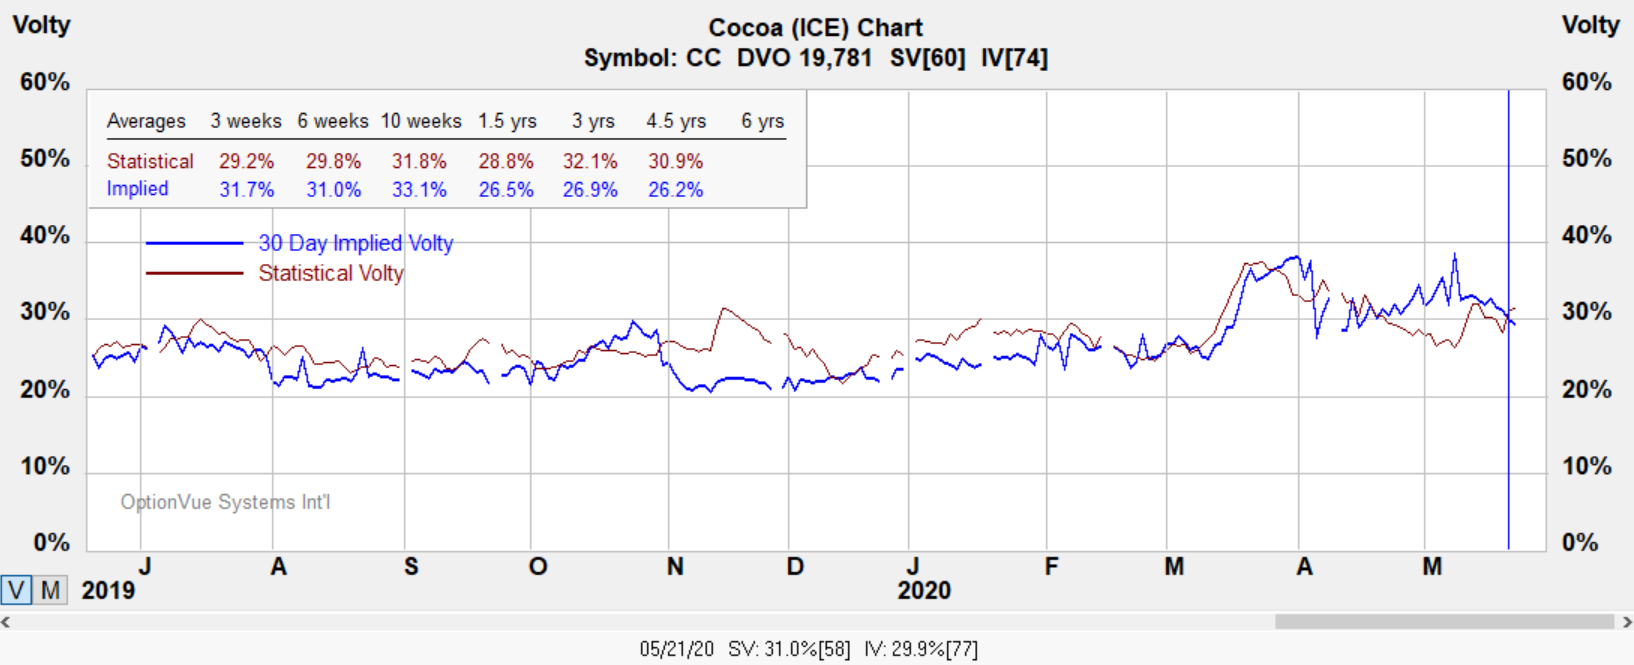
Volatility
Options fall into the category of being slightly overvalued in volatile markets in the weekly options report. Ask about the Weekly Option's Report for more information.
Notes:
Contract Size - 10 MT. Code: CC Exchange: ICE
Tick Size: Outright: dollars per metric ton with $1.00/metric ton, equivalent to $10.00 per contract
Trading Hours: 4:45 PM - 1:30 AM SGT; 16:45 - 01:30 SGT.
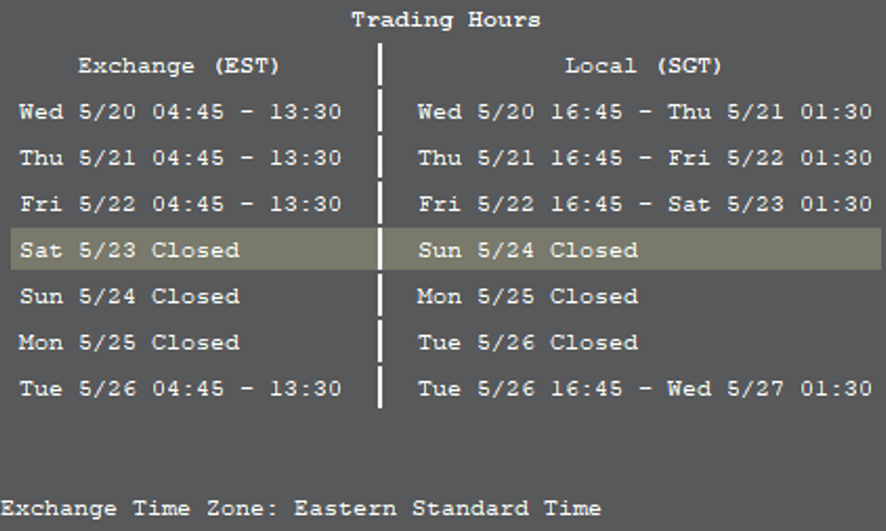
**In addition to the Pre-Open start time shown above, there will be a Post-Close Pre-Open order entry session from 2:00 pm to 6:00 pm NY time on the prior Exchange business day..
?ml=1" class="modal_link" data-modal-class-name="no_title">* Tip: Click here to read a helpful tip about Cocoa futures and options
Charts
Weekly and Daily Charts
?ml=1" class="modal_link" data-modal-class-name="no_title">* Tip: Click here on enlarging images
Strategies
Below illustrates a directional play to the upside using a bull put.
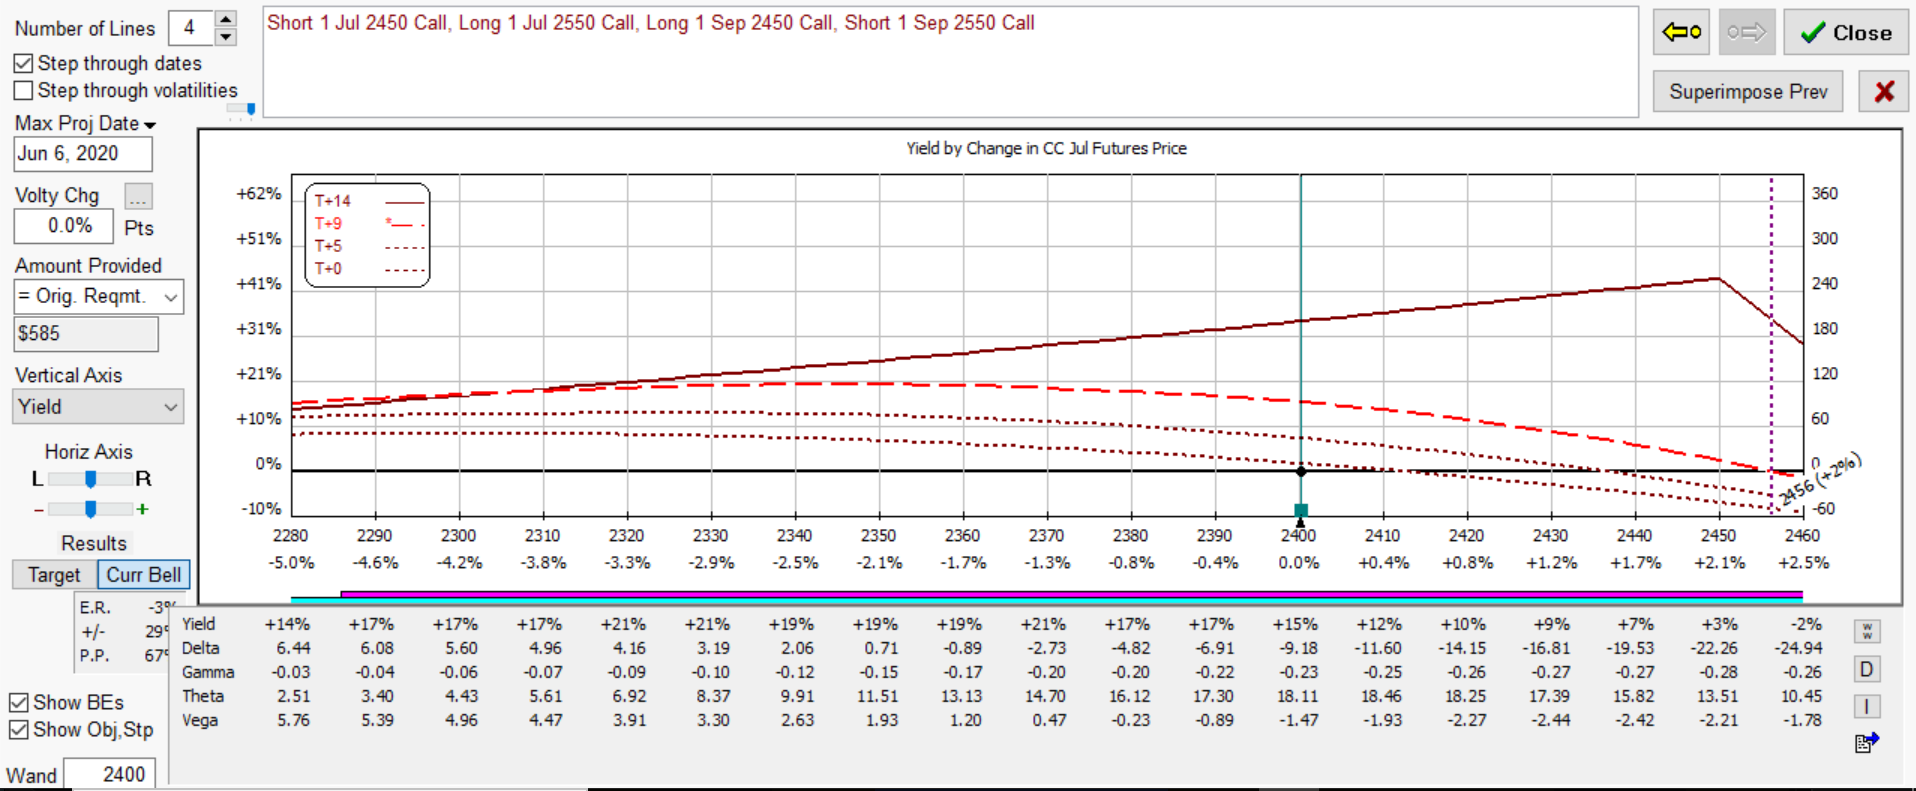
The % yield shown in the diagrams below represent an estimated return on margin from projected dates shown below on a 1 LOT. The structure has positive time decay which is an advantage over holding outright options.
Below is a bearish vertical swap. The last trading day for July options is June 5th so consider closing position by or around the 3rd or if underlying July contract exceeds 2470 / MT.
Webcast
Join our Free Webcast each month and learn how these strategies can benefit your trading.