Get your copy of Paul Forchione's book describing advanced techniques on futures options. Learn techniques from a professional options trader to manage risk while speculating on futures markets.
Click here to view Paul's eBook
By using our website, you agree to accept our terms of use (click to read)
Volatility
Overall volatililty has been low while market trends higher.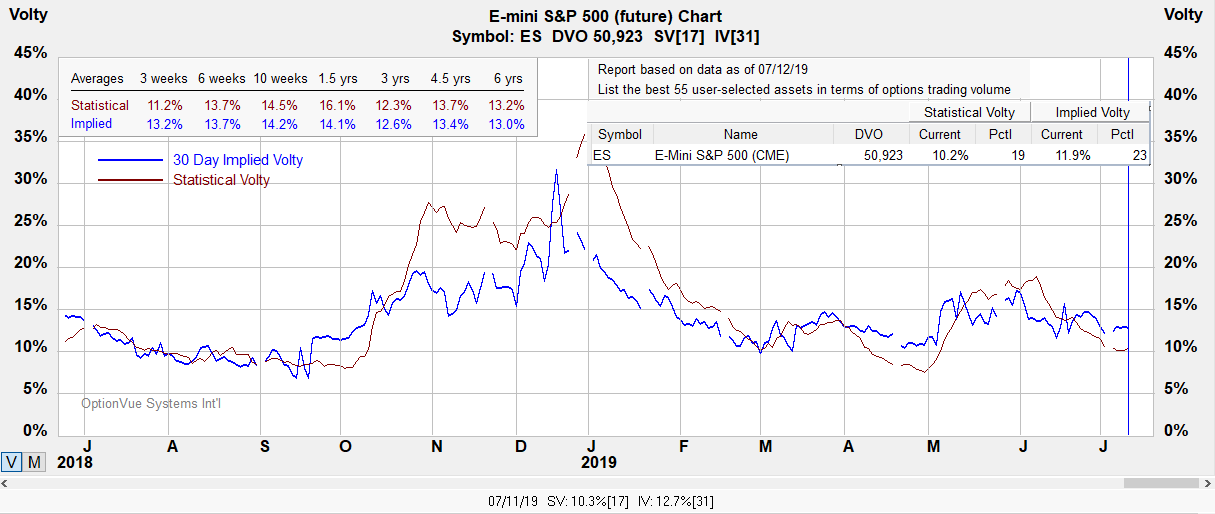
Notes:
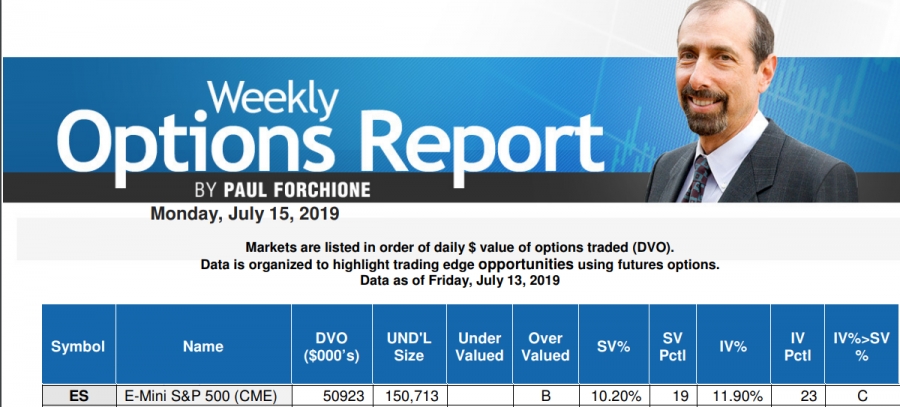
Contract Size - $50 x S&P 500 Index.
Tick Size: Outright: 0.25 index points=$12.50
Trading Hours: CME Globex: Sunday - Friday 6:00 p.m. - 5:00 p.m. Eastern Time (ET) with trading halt 4:15 p.m. - 4:30 p.m.
?ml=1" class="modal_link" data-modal-class-name="no_title">* Tip: Click here to read a helpful tip about E-Mini S&P futures and options
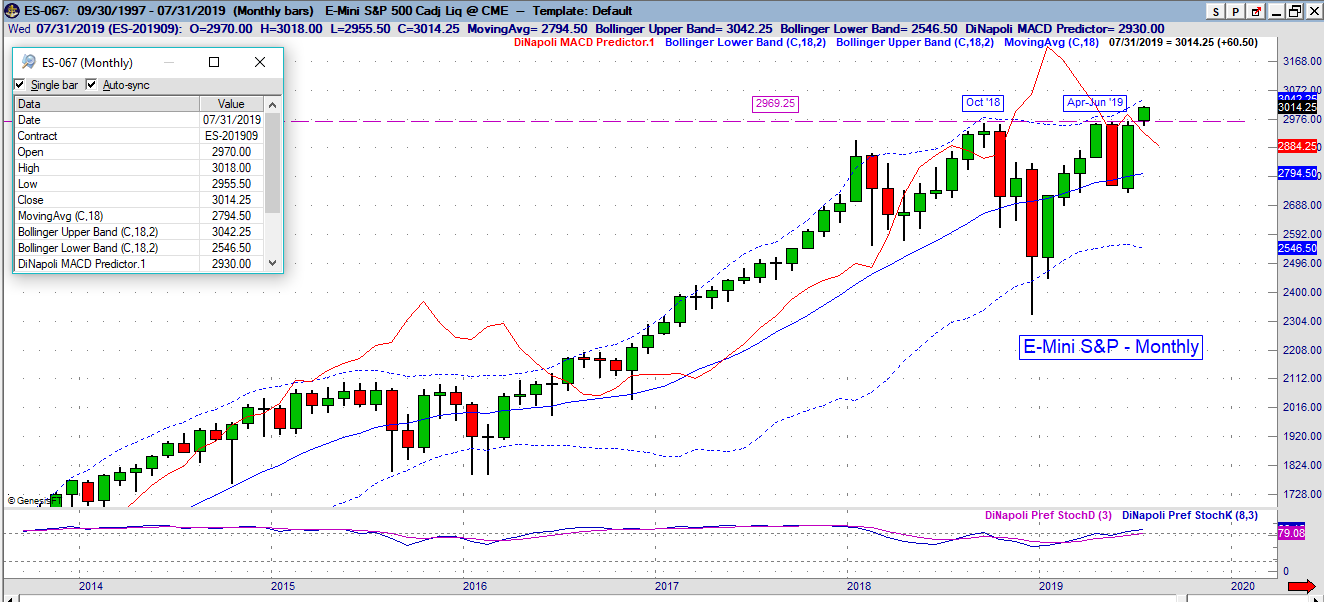
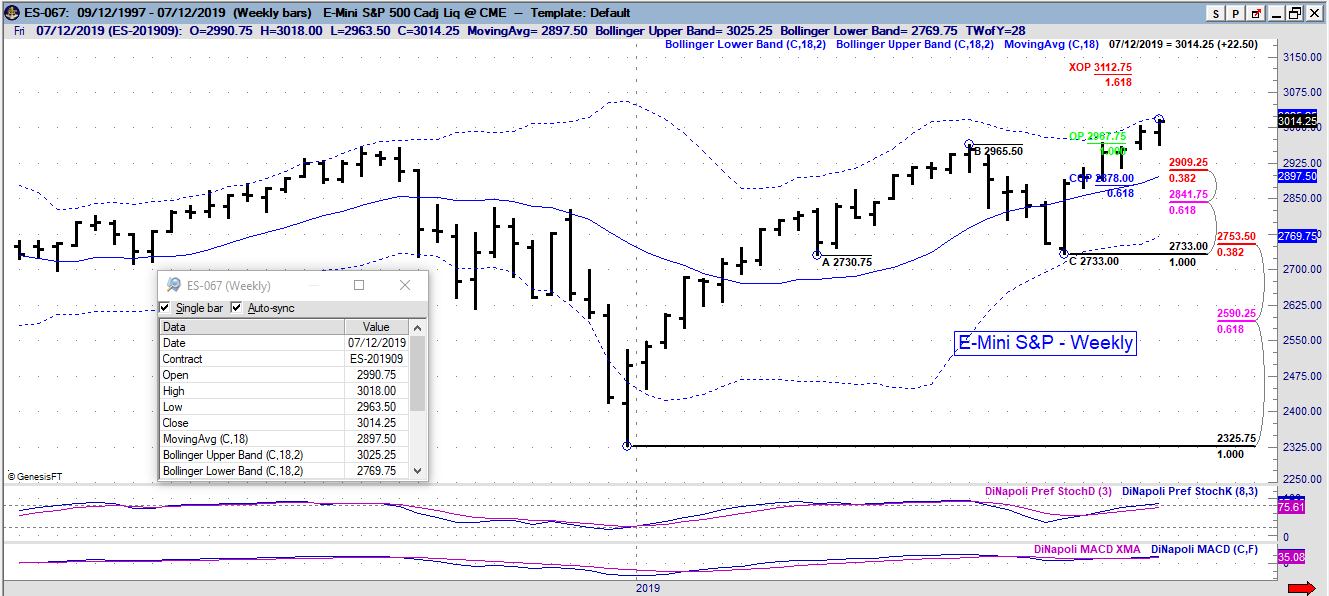
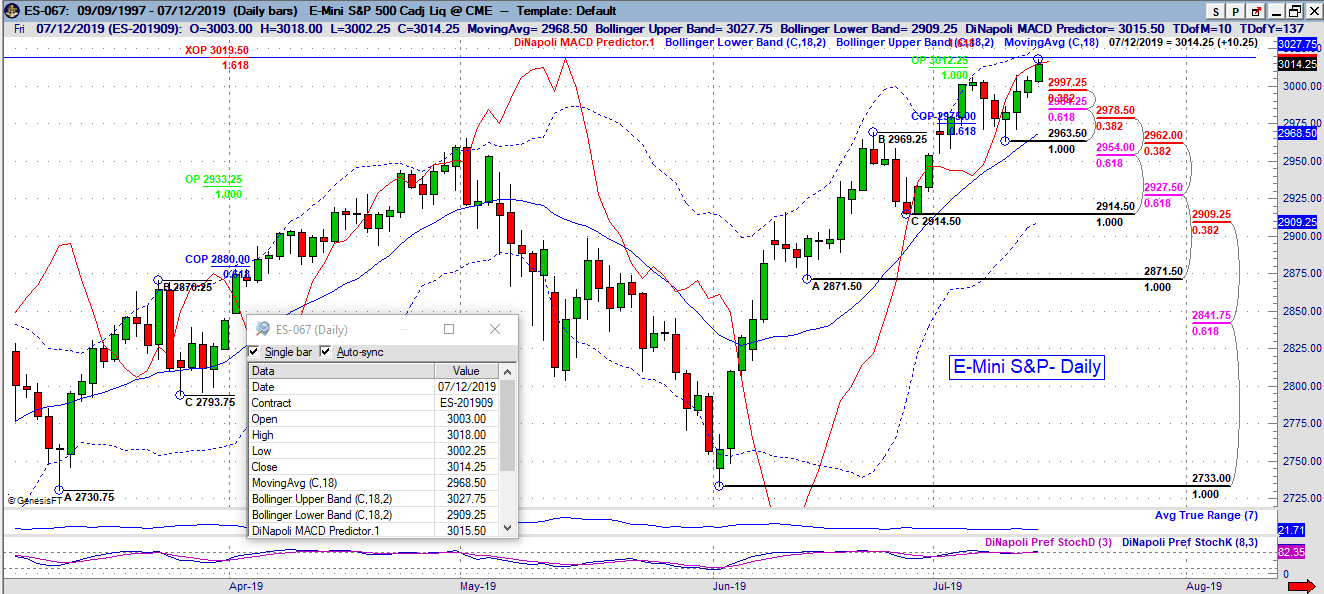
E-Mini S&P
Below are charts for reference. F3=38.2 ; F5 = 61.8 retracements ; BB = Bollinger Bands
Currently the E-mini S&P closed July 12th @ 3014.25
Direction
2976 above resistance high monthly
3025.25 top of BB monthly, high volatility week, Stoch up
3015.50 below MACDP daily. Rise above bullish
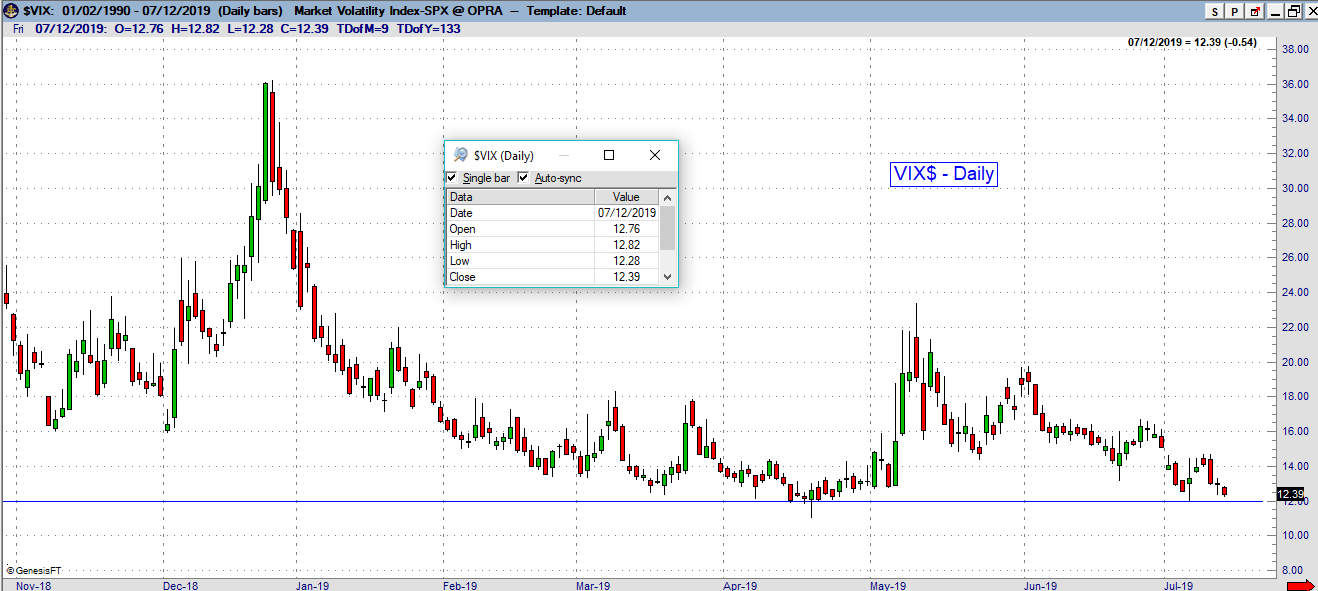
VIX at low of 12.39
Resistance
3027.75 upper BB band daily
3019.50 XOP resistance daily high
Support
2997.25 F3 daily
2984.25 F5 daily
2978.50 F3 daily
2909.25 F3 weekly
2897.50 center BB weekly
2841.75 F5 weekly
2590.25 F5 weekly
Magnified technical view.
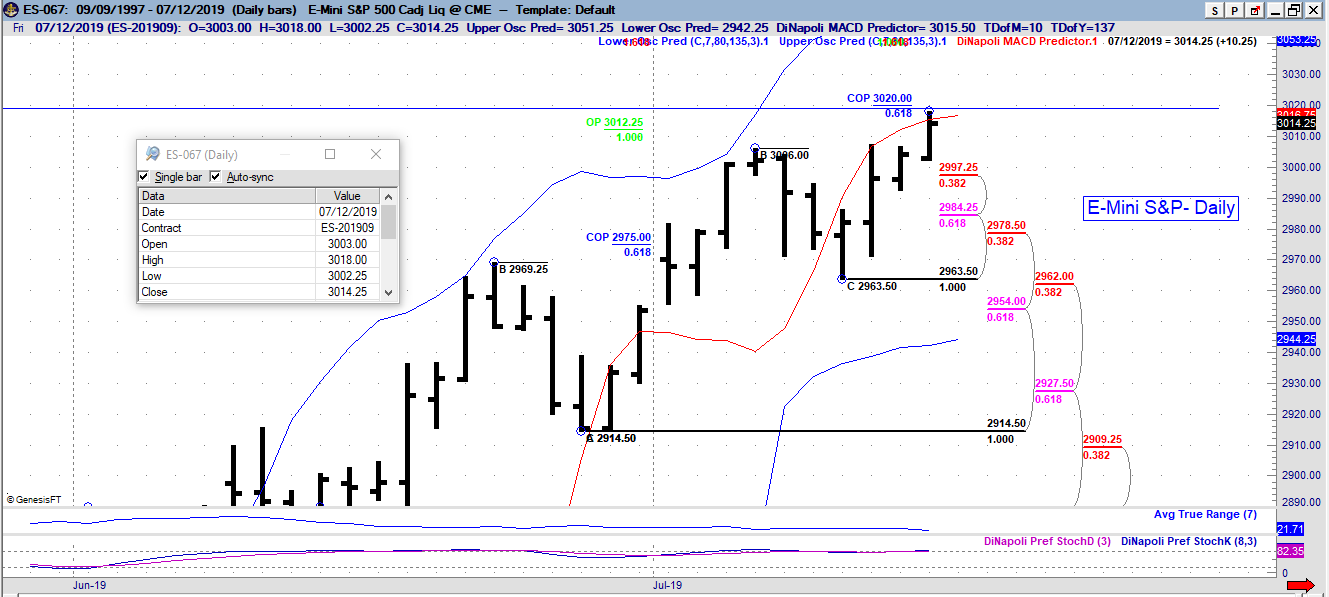
?ml=1" class="modal_link" data-modal-class-name="no_title">* Tip: Click here on enlarging images
Strategies
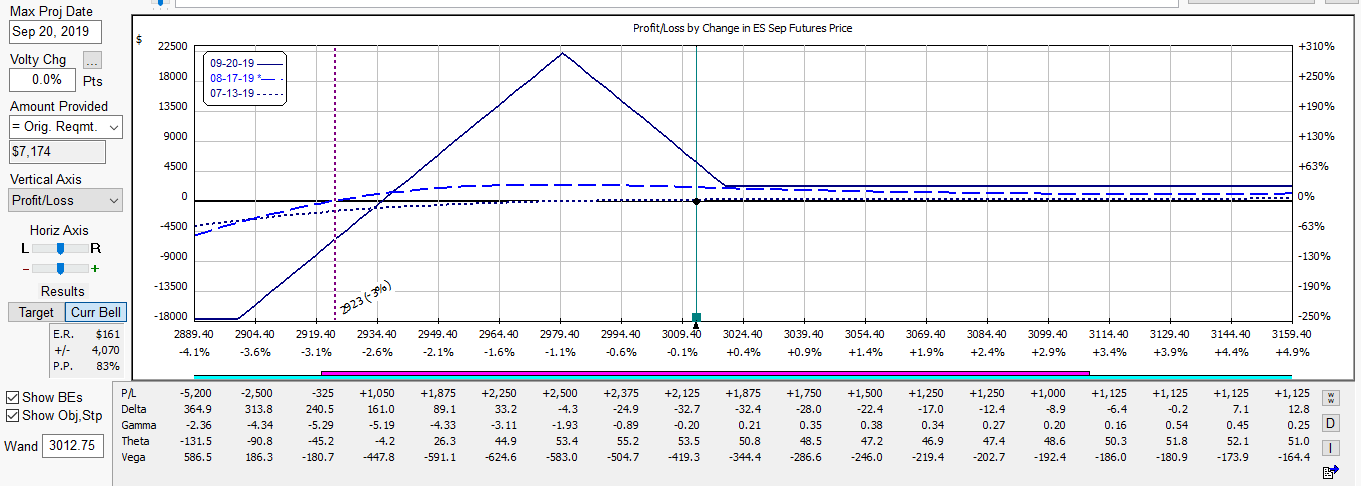
Below is a broken wing butterfly with negative vega.
The % yield shown in the diagrams below represent an estimated return on margin from projected dates shown below. The structure has positive time decay which is an advantage over holding outright options. Position has a wide range of prices to profit from and can be adjusted. The position would lose if price broke quickly out of the range without any adjustment.
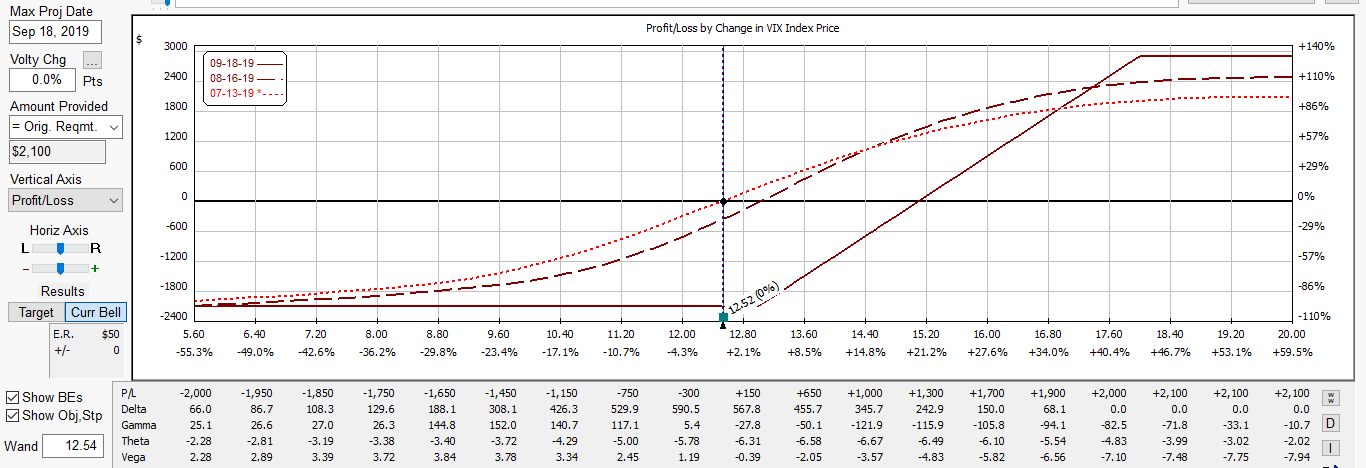
Below is a calendar spread on VIX options hedging vega risk to the downside as a possible add-on consideration. Strategy variations can be found in Paul Forchione's eBooks with link listed above.
Join our Free Webcast each month and learn how these strategies can benefit your trading.