Get your copy of Paul Forchione's book describing advanced techniques on futures options. Learn techniques from a professional options trader to manage risk while speculating on futures markets.

Click here to view Paul's eBook
By using our website, you agree to accept our terms of use (click to read)
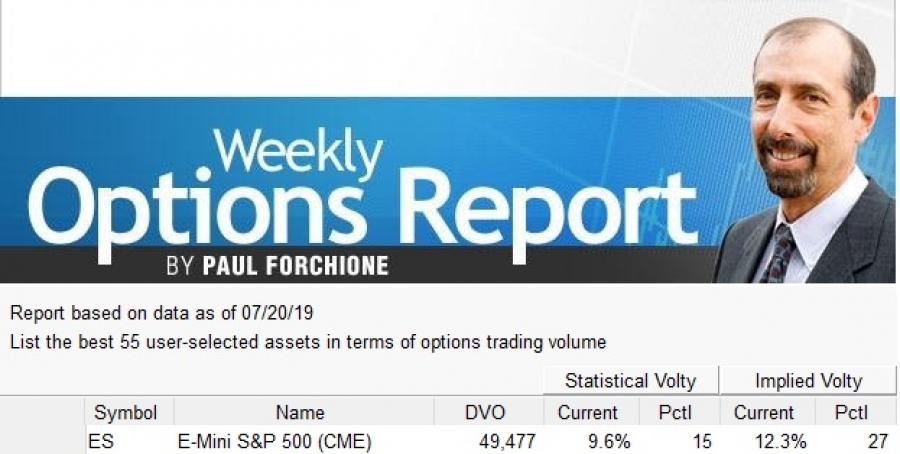
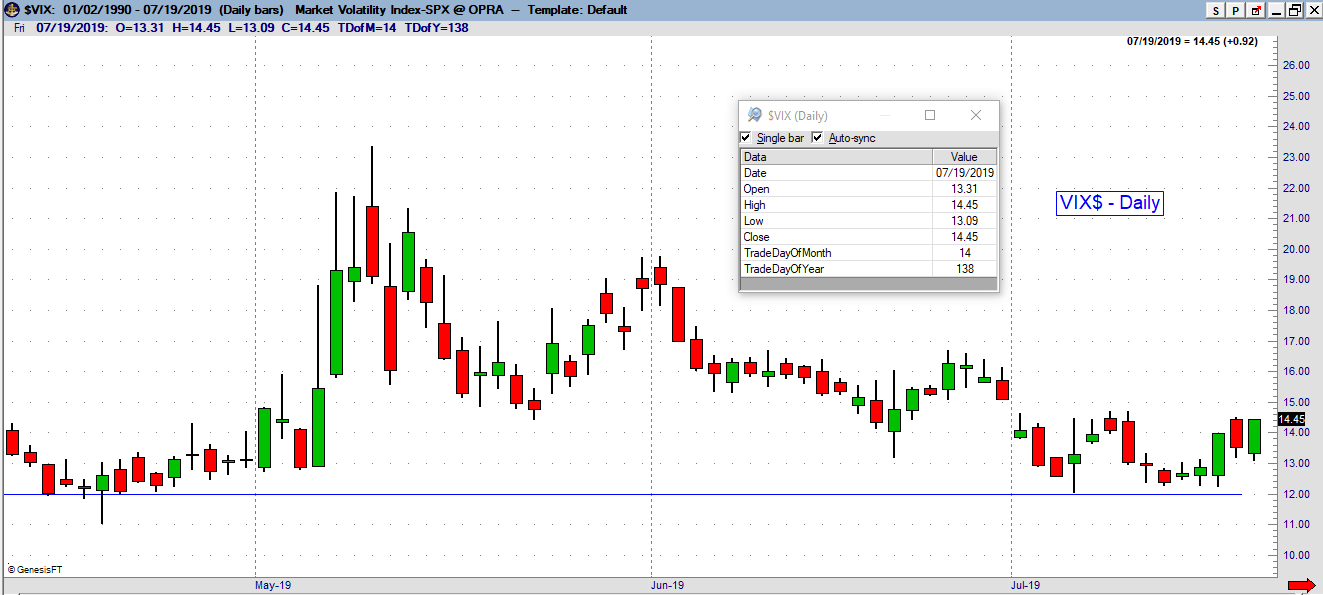
Volatility
IV still above statistical levels in the 27th percentile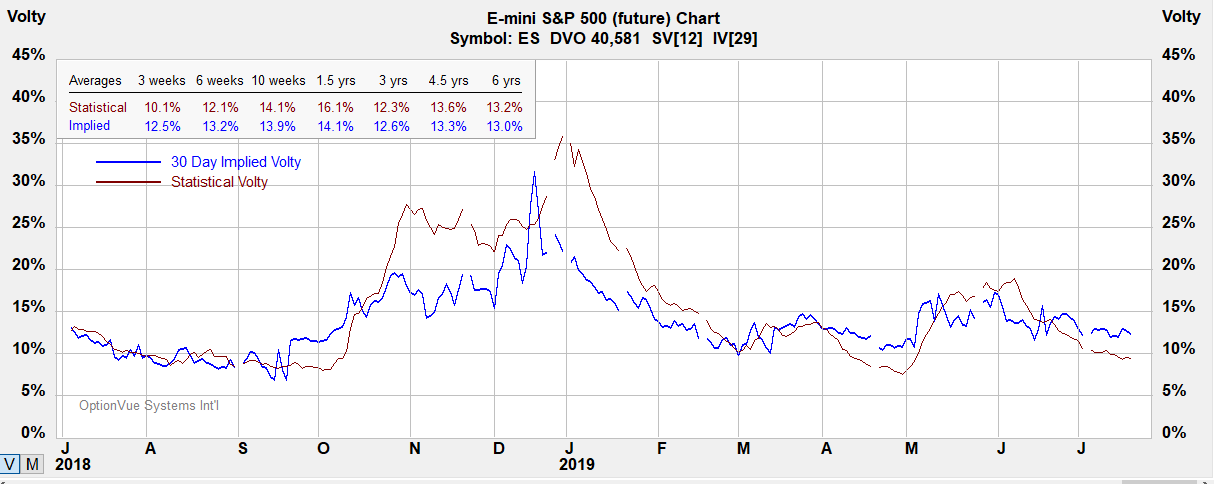
Notes:
Contract Size - $50 x S&P 500 Index.
Tick Size: Outright: 0.25 index points=$12.50
Trading Hours: CME Globex: Sunday - Friday 6:00 p.m. - 5:00 p.m. Eastern Time (ET) with trading halt 4:15 p.m. - 4:30 p.m.
?ml=1" class="modal_link" data-modal-class-name="no_title">* Tip: Click here to read a helpful tip about E-Mini S&P futures and options
E-Mini S&P
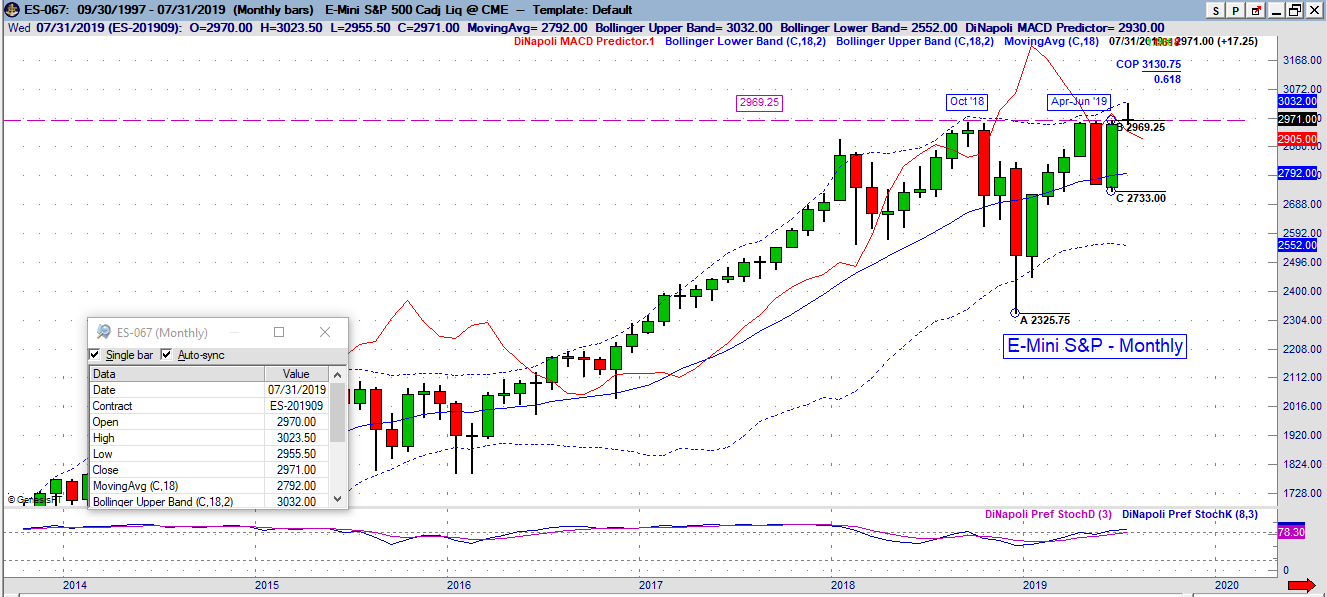
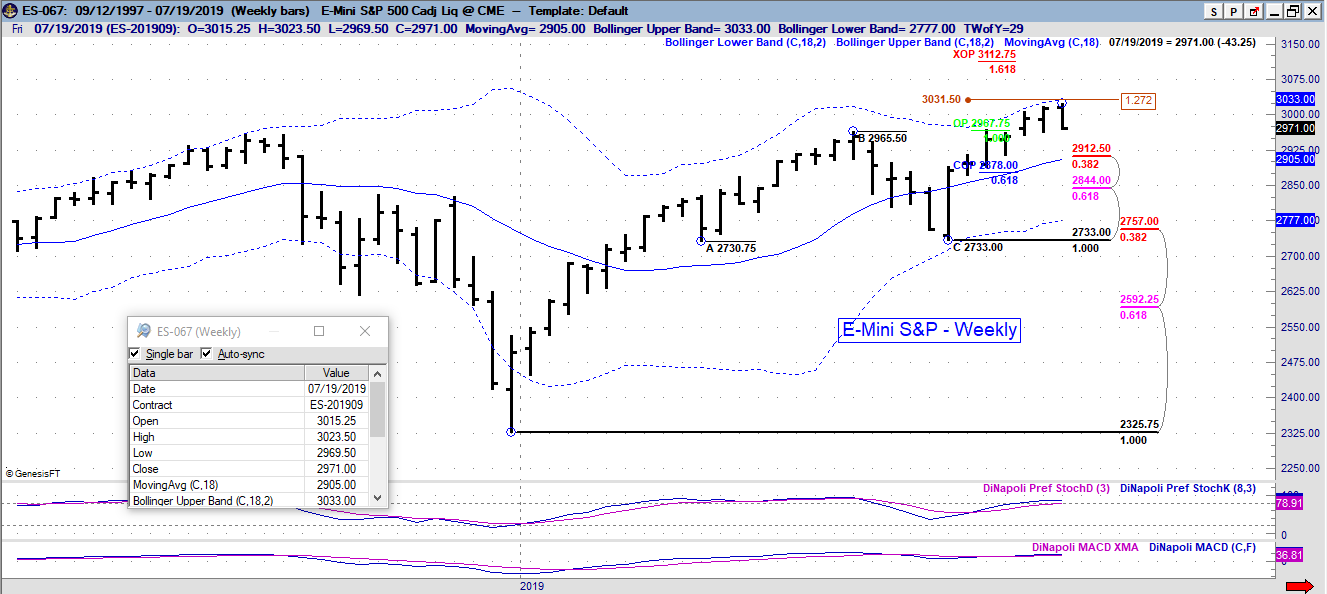
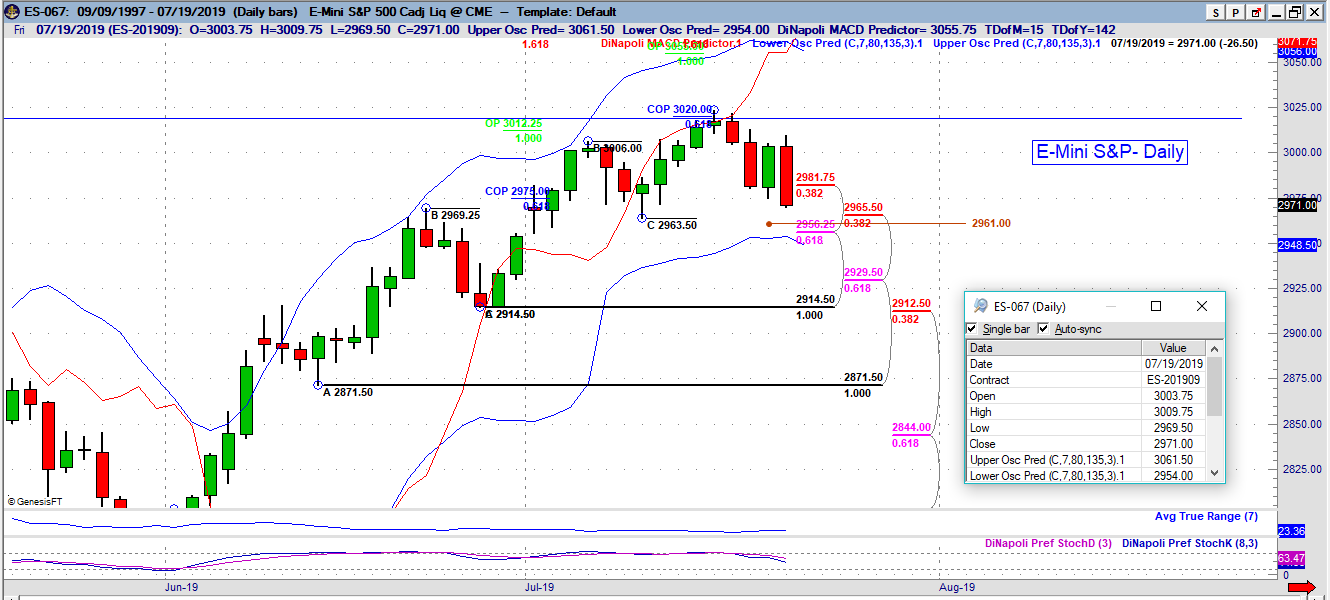
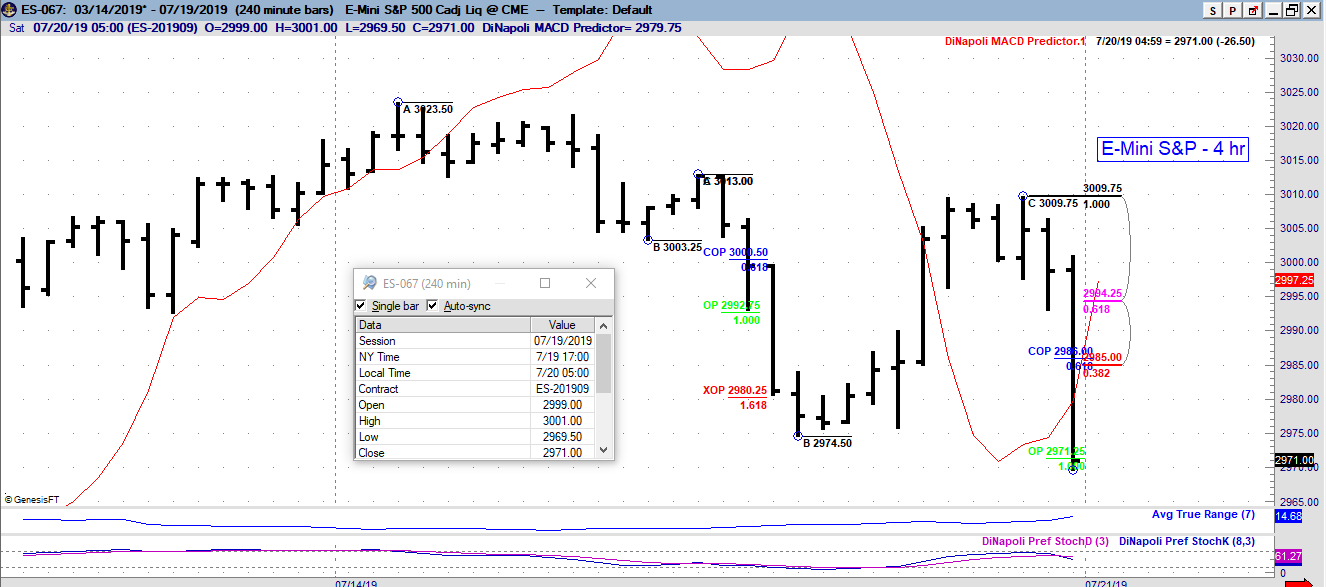
Below are charts for reference. F3=38.2 ; F5 = 61.8 retracements ; BB = Bollinger Bands
Currently the E-mini S&P closed July 19th @ 2971
Direction
Last week close above MACDP. monthly
Resistance
3130.75 COP monthly
3112.75 XOP weekly
3063.00 Upper OscP band. weekly
3031.50 127.2% weekly
Support
2969.25 Prior high turned support. monthly
2912.50 F3 weekly
2844.00 F5 weekly
2956-65 K daily
2948.50 Lower OscP band. daily
2929.50 F5. daily
?ml=1" class="modal_link" data-modal-class-name="no_title">* Tip: Click here on enlarging images
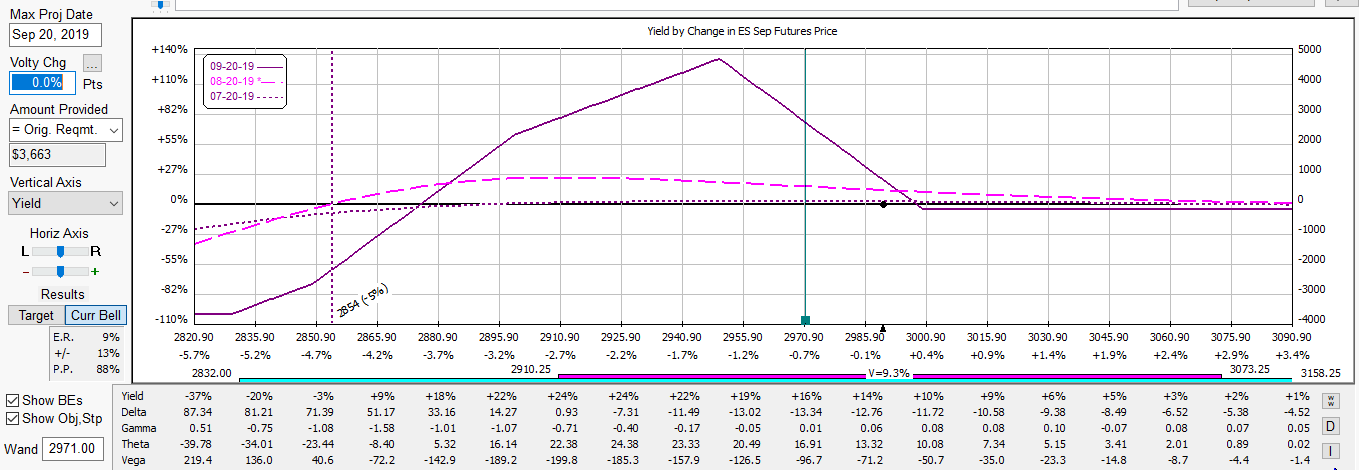
Strategies
Below is an example of a Kevlar trade.
The % yield shown in the diagrams below represent an estimated return on margin from projected dates shown below. The structure has positive time decay which is an advantage over holding outright options. Position has a wide range of prices to profit from and can be adjusted. The position would lose if price broke quickly out of the range to the downside without any adjustment.
Join our Free Webcast each month and learn how these strategies can benefit your trading.