Get your copy of Paul Forchione's book, "Trading Iron Condors". Learn techniques from a professional options trader to manage risk while speculating on futures markets.

Click here to view Paul's eBook
By using our website, you agree to accept our terms of use (click to read)
Commentary
Henry Hub on rise, US energy independence in focusBy Blu Putnam, Chief Economist & Erik Norland, Senior Economist,
CME Group Natural Gas:
The Bust Within the Boom
- Surge in US exports since 2017 narrows price gaps with Europe, Asia
- Henry Hub gaining traction as global benchmark for natural gas prices
- Natural gas storage levels at five-year high as price slips to near four-year low
- Rig counts plummeting due to dwindling capital expenditure
Read Article
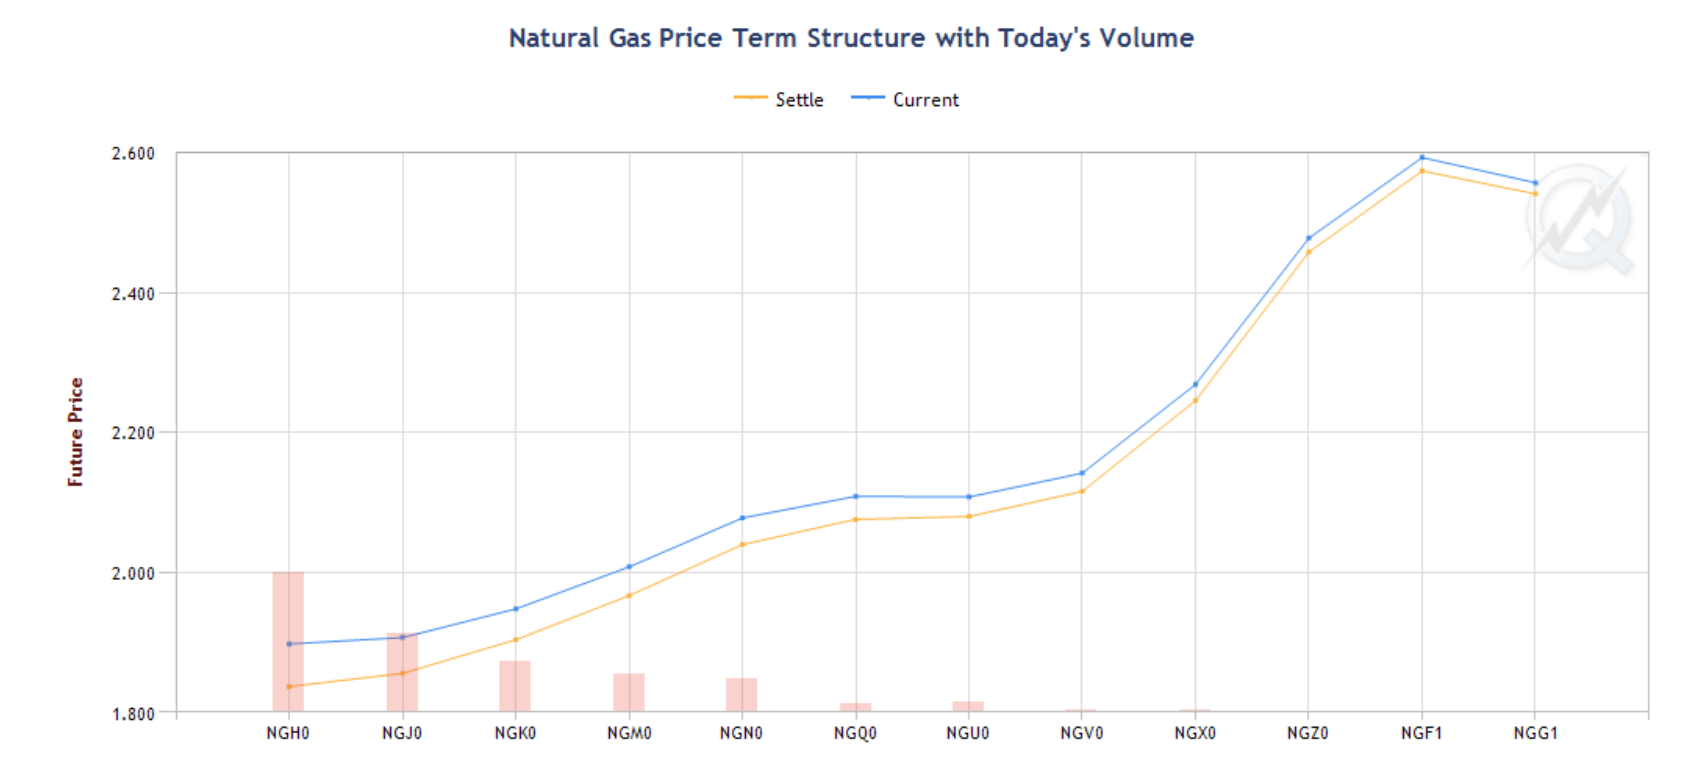
Term Structure
Volatility
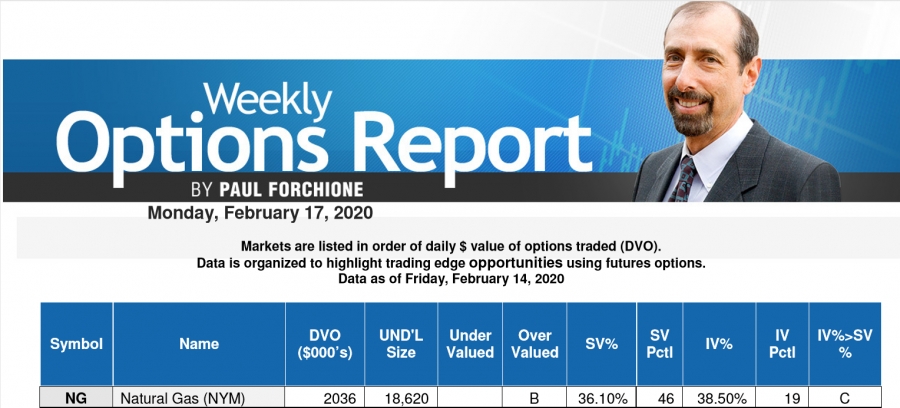
Options fall into the category of being slightly overvalued in non-volatile markets in the weekly options report.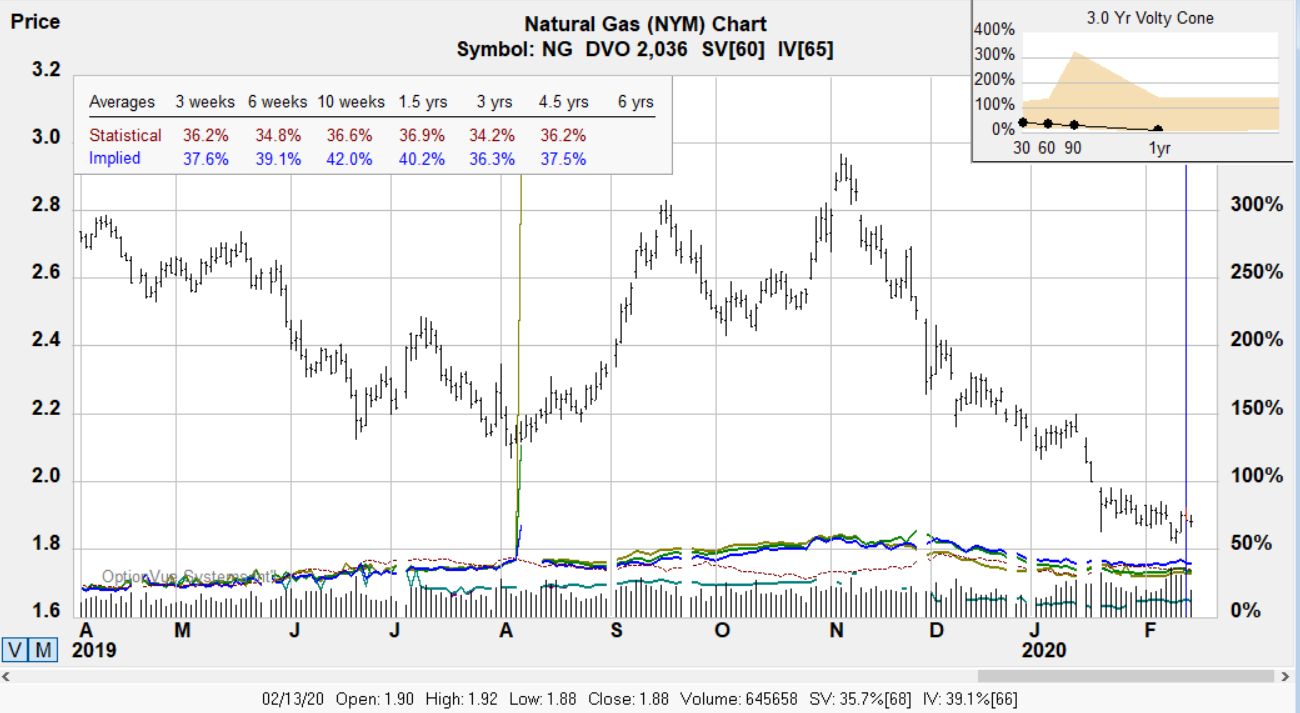
Notes:
Contract Size - 10,000 million British thermal units (mmBtu).
Tick Size: U.S. Dollars and Cents per mmBTU
Trading Hours: Sunday - Friday 6:00 p.m. - 5:00 p.m. (5:00 p.m. - 4:00 p.m. Chicago Time/CT) with a 60-minute break each day beginning at 5:00 p.m. (4:00 p.m. CT)
?ml=1" class="modal_link" data-modal-class-name="no_title">* Tip: Click here to read a helpful tip about Natural Gas futures and options
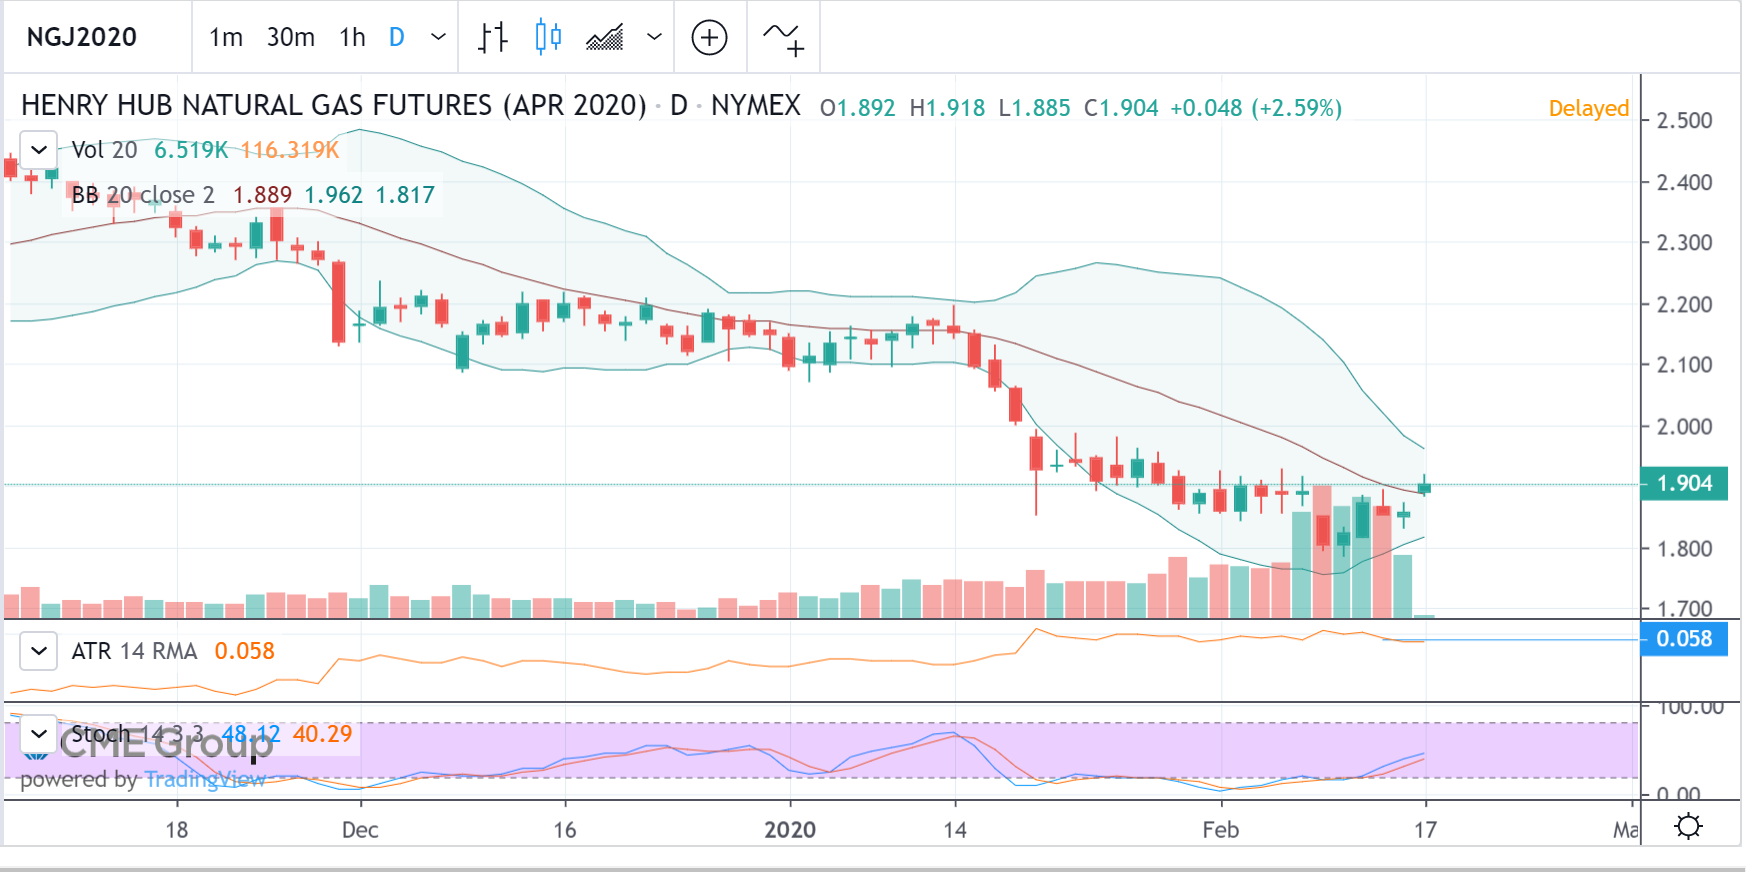
Natural Gas Charts
Below are March and April charts for reference since the front expires 26th Feb.
March
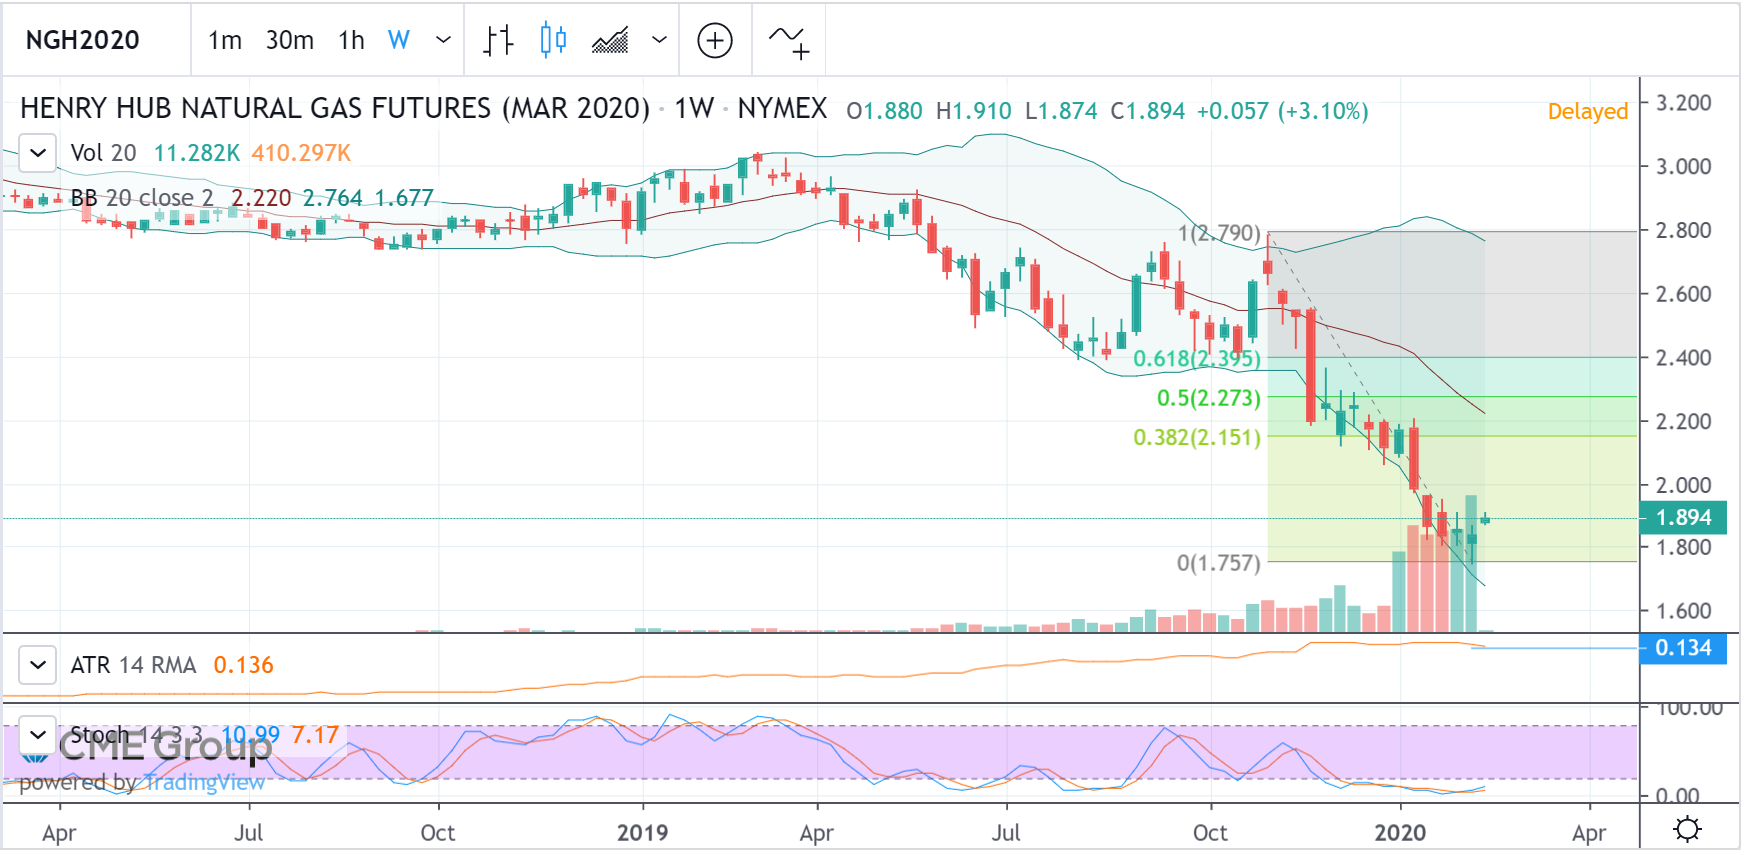
April
?ml=1" class="modal_link" data-modal-class-name="no_title">* Tip: Click here on enlarging images
Strategies
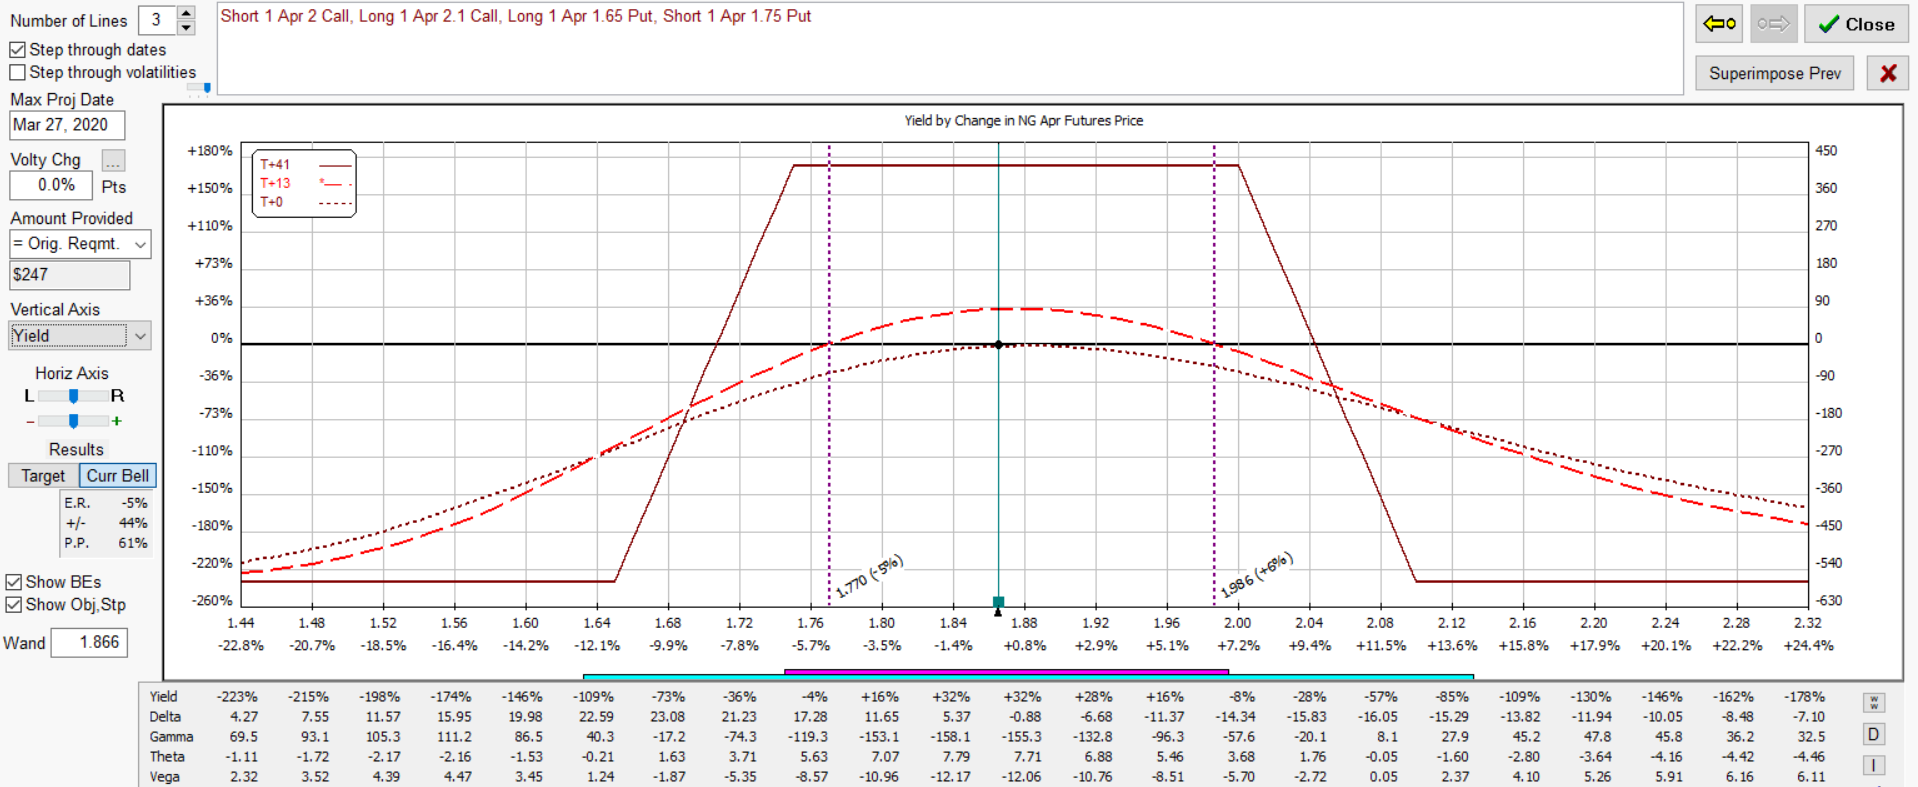
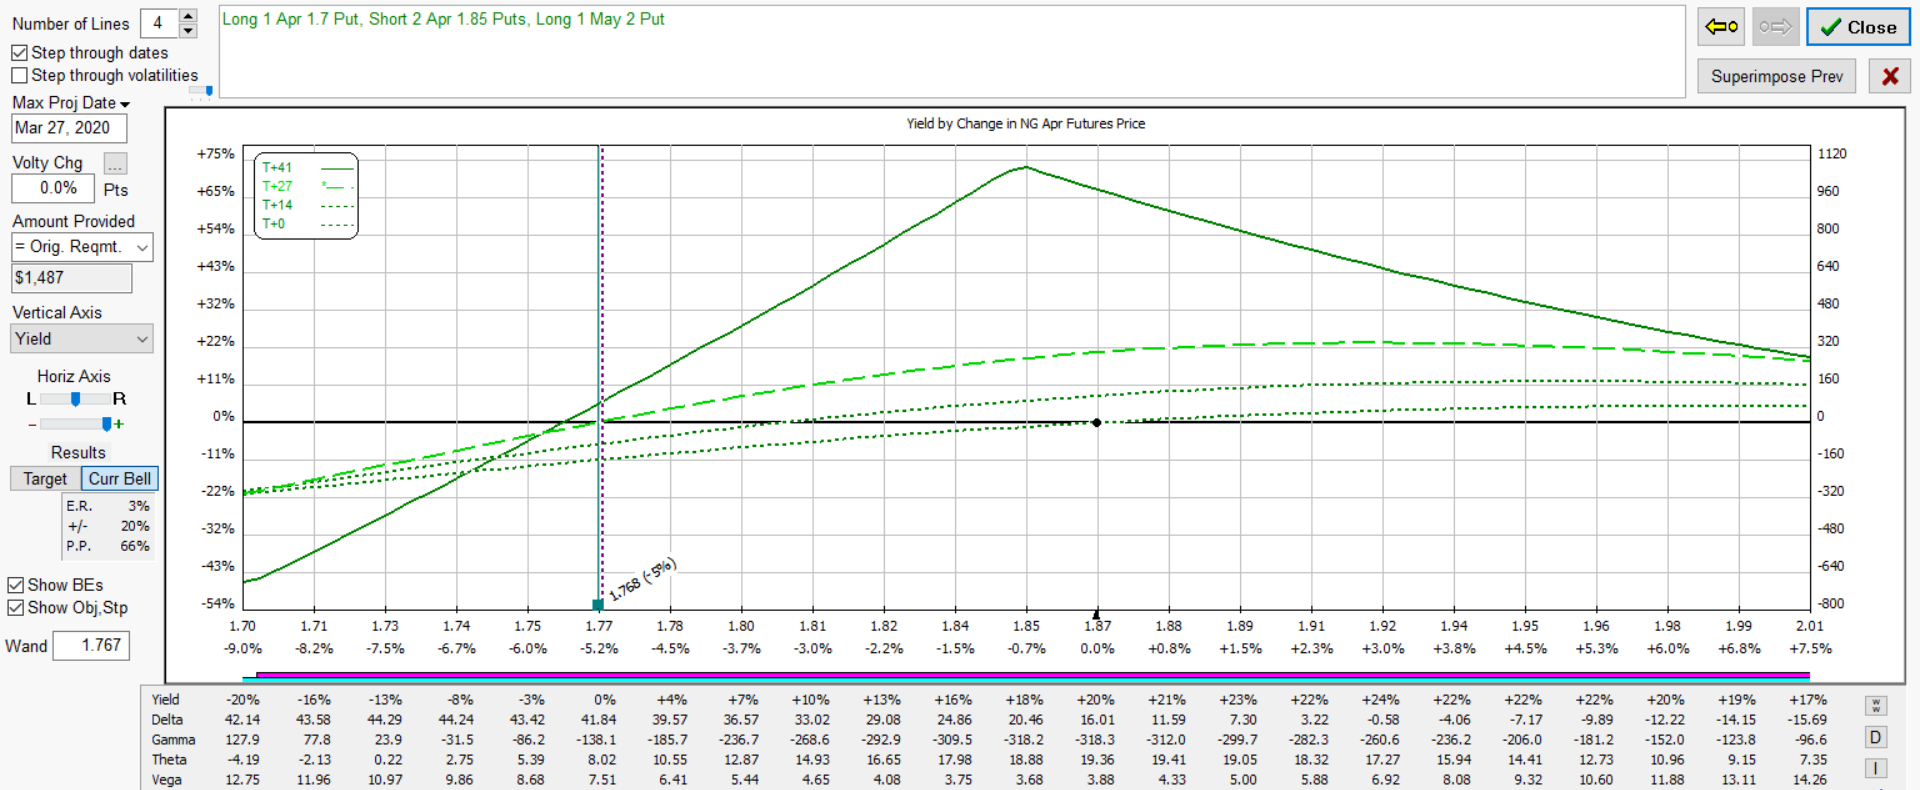
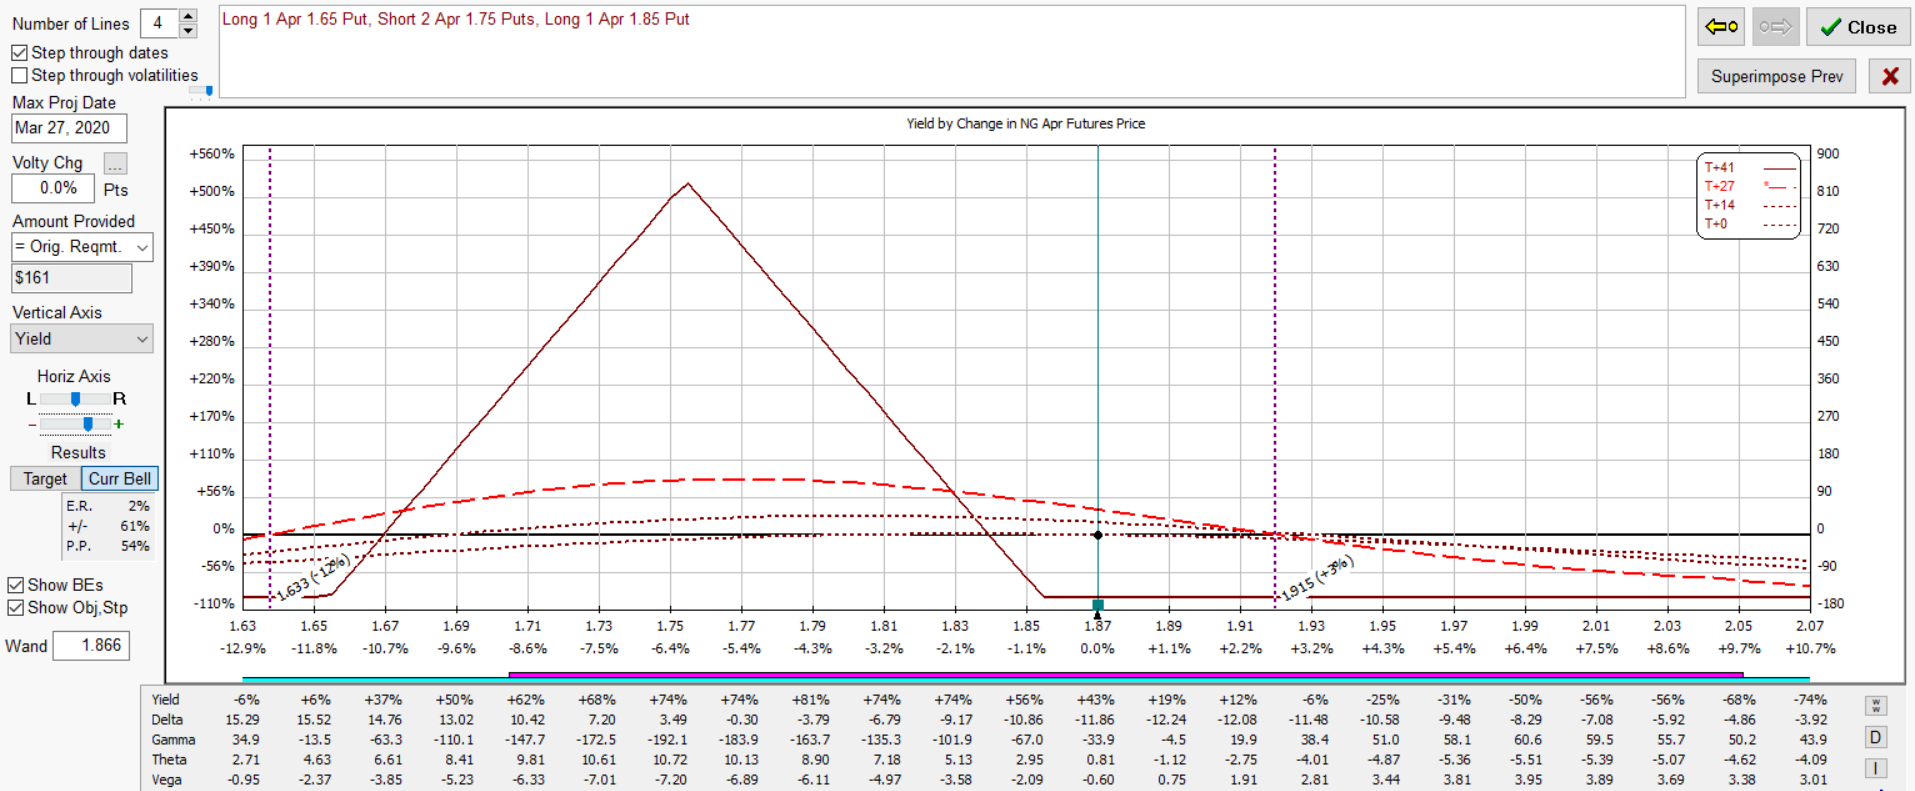
Below is an iron condor relatively delta neutral with estimated margin per 1 LOT. The illustration beneath is a calendarized version using put options with a slight directional bias bullish. Each has positive time decay where the iron condor will benefit slightly from a decline in implied volatility while the latter is opposite. Last is a butterfly using put options. Each would be impacted by changes in the April NG futures.
The % yield shown in the diagrams below represent an estimated return on margin from projected dates shown below. The structure has positive time decay which is an advantage over holding outright options.
Iron Condor
Calendarized Condor with Puts
Butterfly
Join our Free Webcast each month and learn how these strategies can benefit your trading.