Get your copy of Paul Forchione's book, "Trading Iron Condors". Learn techniques from a professional options trader to manage risk while speculating on futures markets.

Click here to view Paul's eBook
By using our website, you agree to accept our terms of use (click to read)
Commentary
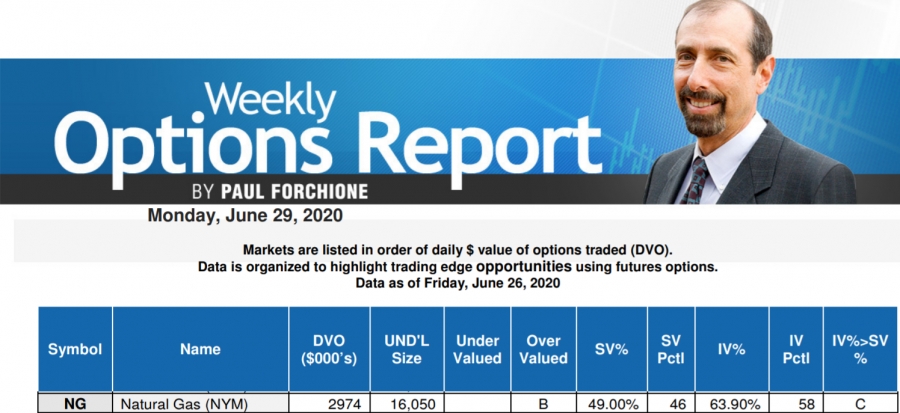
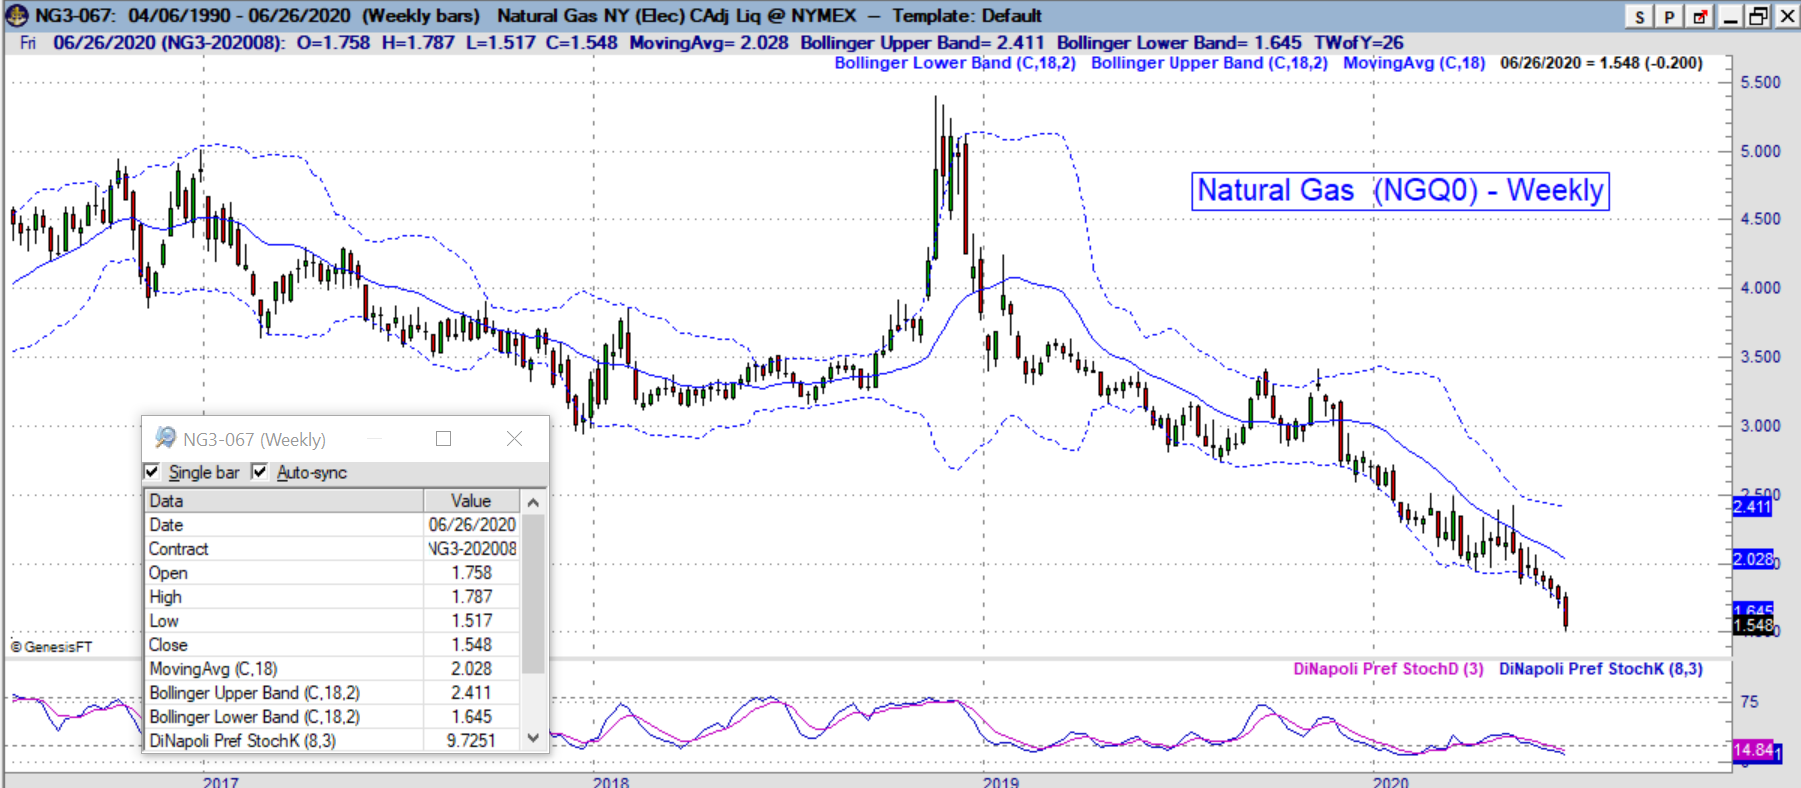
- Natural Gas down 7.5% on close 1.537 over 8% on the lows 1.517 Aug NG
- 25 year lows with rig counts falling, production suffering, demand is light
- EIA 120bil cu/ft build into inventory, larger than expected 105 - 110 expected
- 75 bil cu/ft build expected (5 yr average), more NG going into supplies
- Demand issue, comfortable 70s, no cold. Industrial demand low
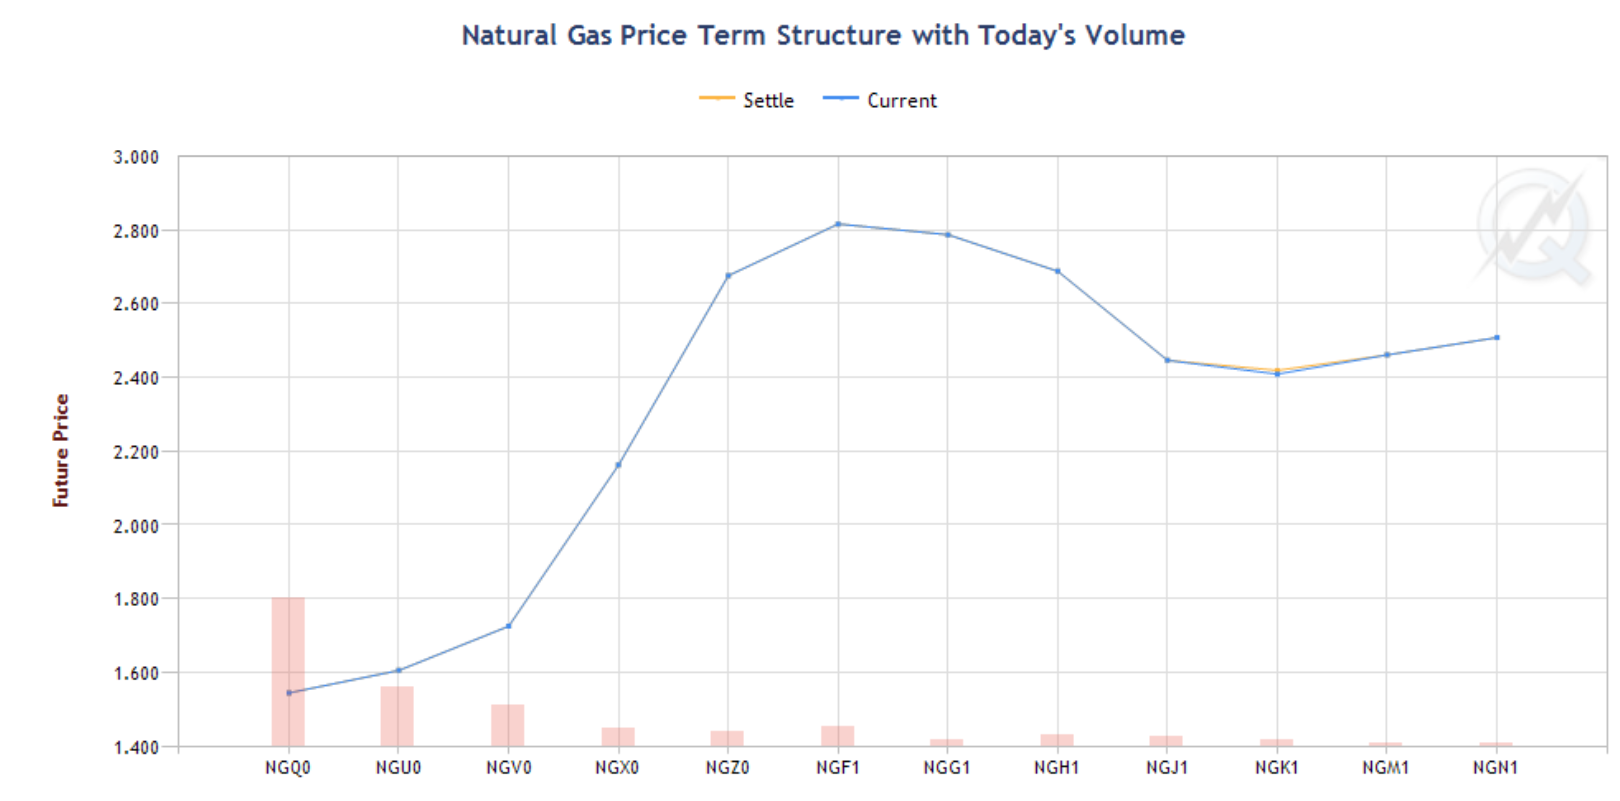
Term Structure
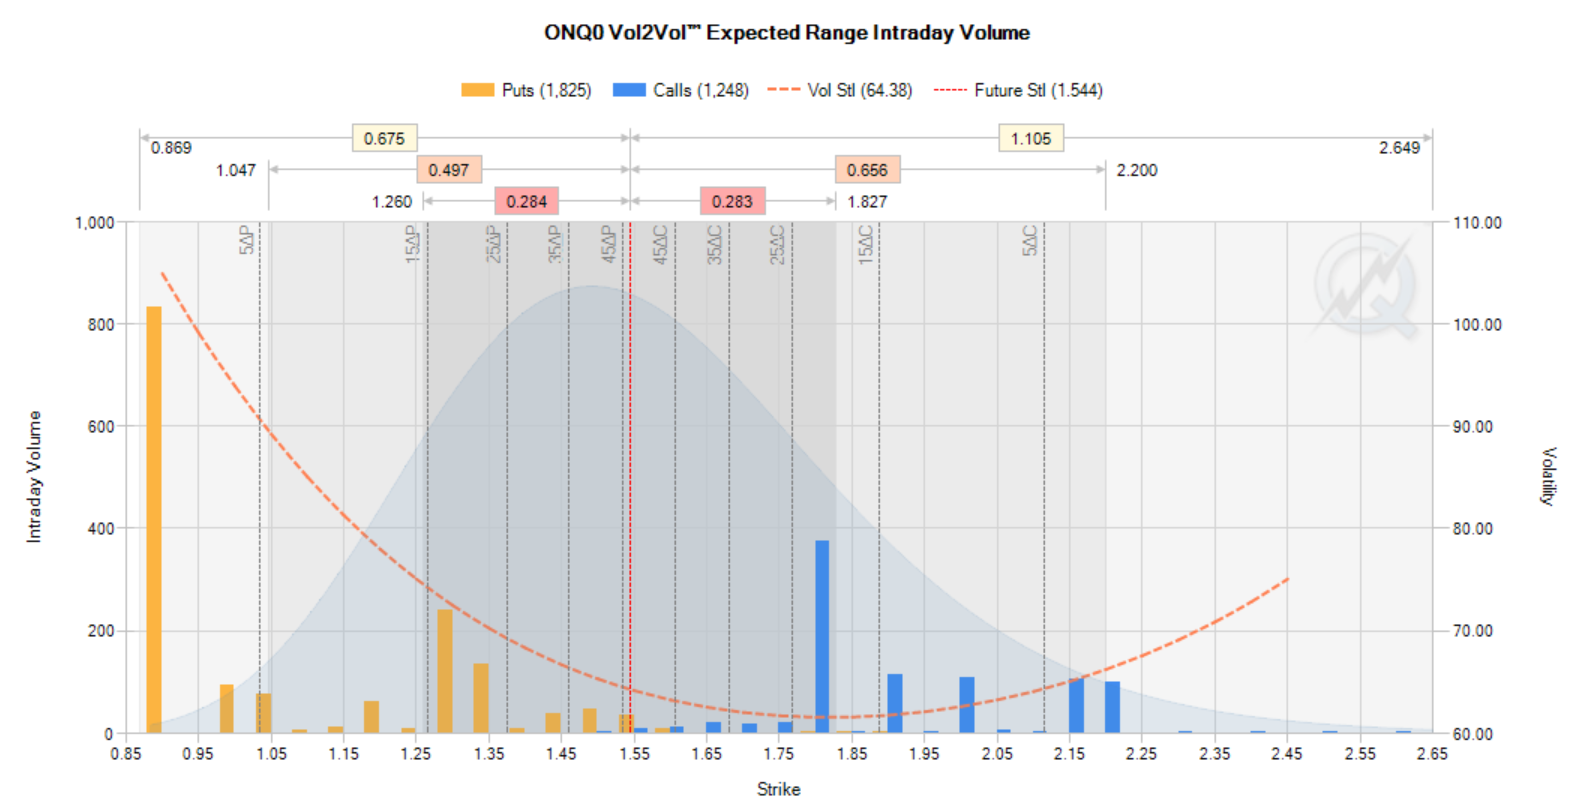
Volatility
Options fall into the category of being slightly overvalued in non-volatile markets in the weekly options report.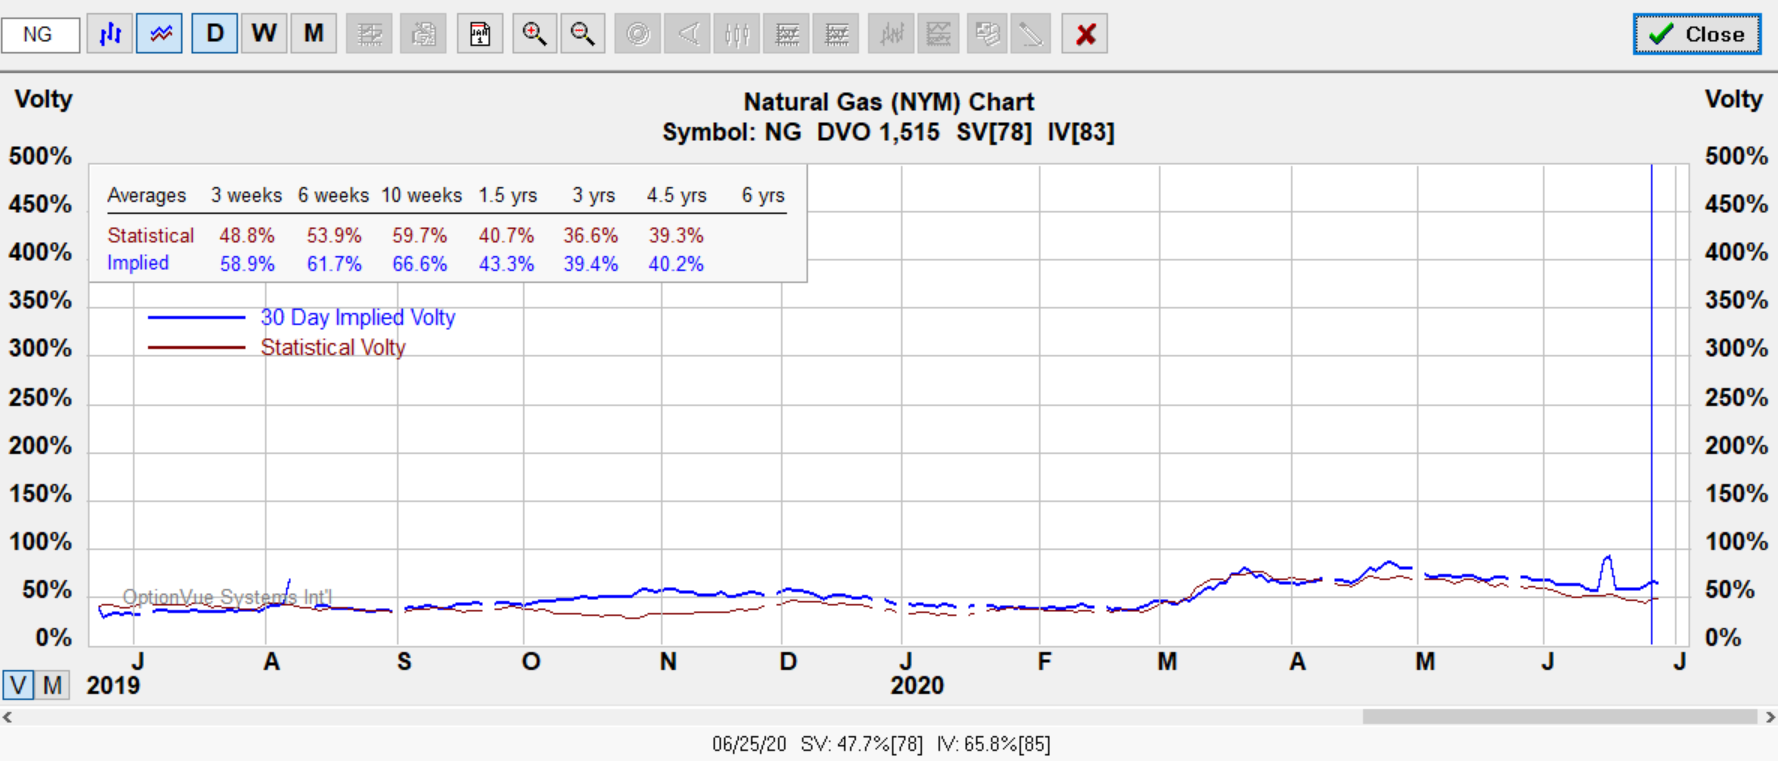
Notes:
Contract Size - 10,000 million British thermal units (mmBtu).
Tick Size: U.S. Dollars and Cents per mmBTU
Trading Hours: Sunday - Friday 6:00 p.m. - 5:00 p.m. (5:00 p.m. - 4:00 p.m. Chicago Time/CT) with a 60-minute break each day beginning at 5:00 p.m. (4:00 p.m. CT)
?ml=1" class="modal_link" data-modal-class-name="no_title">* Tip: Click here to read a helpful tip about Natural Gas futures and options
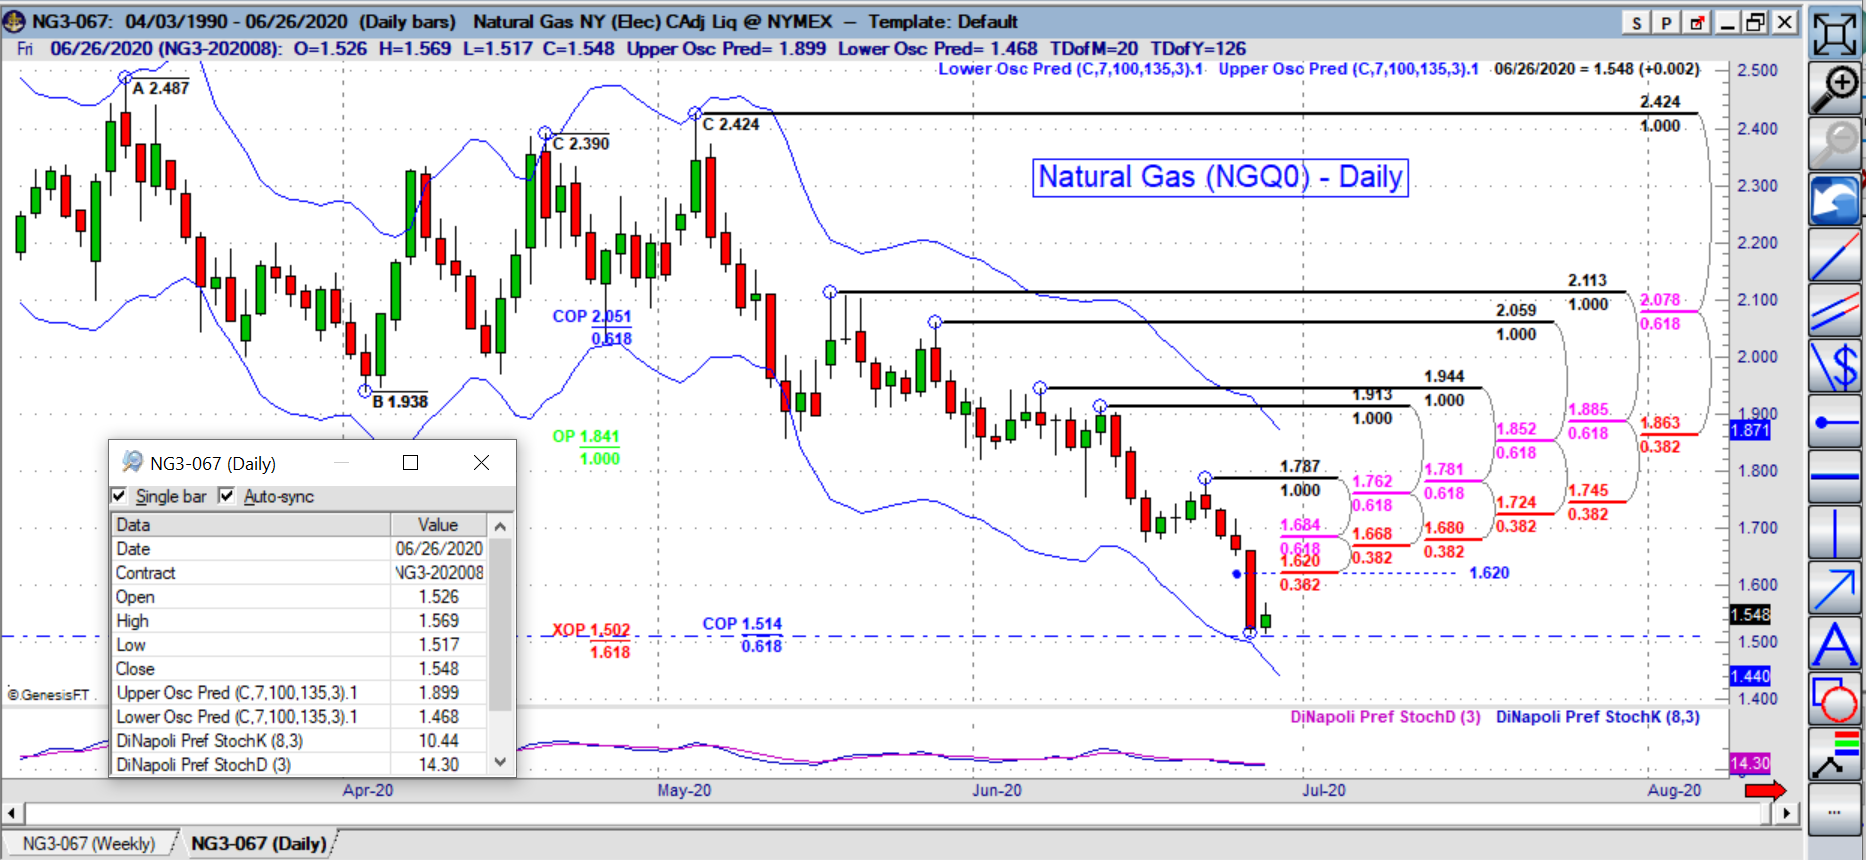
Natural Gas Charts
Below are the August Natural Gas charts
?ml=1" class="modal_link" data-modal-class-name="no_title">* Tip: Click here on enlarging images
Strategies
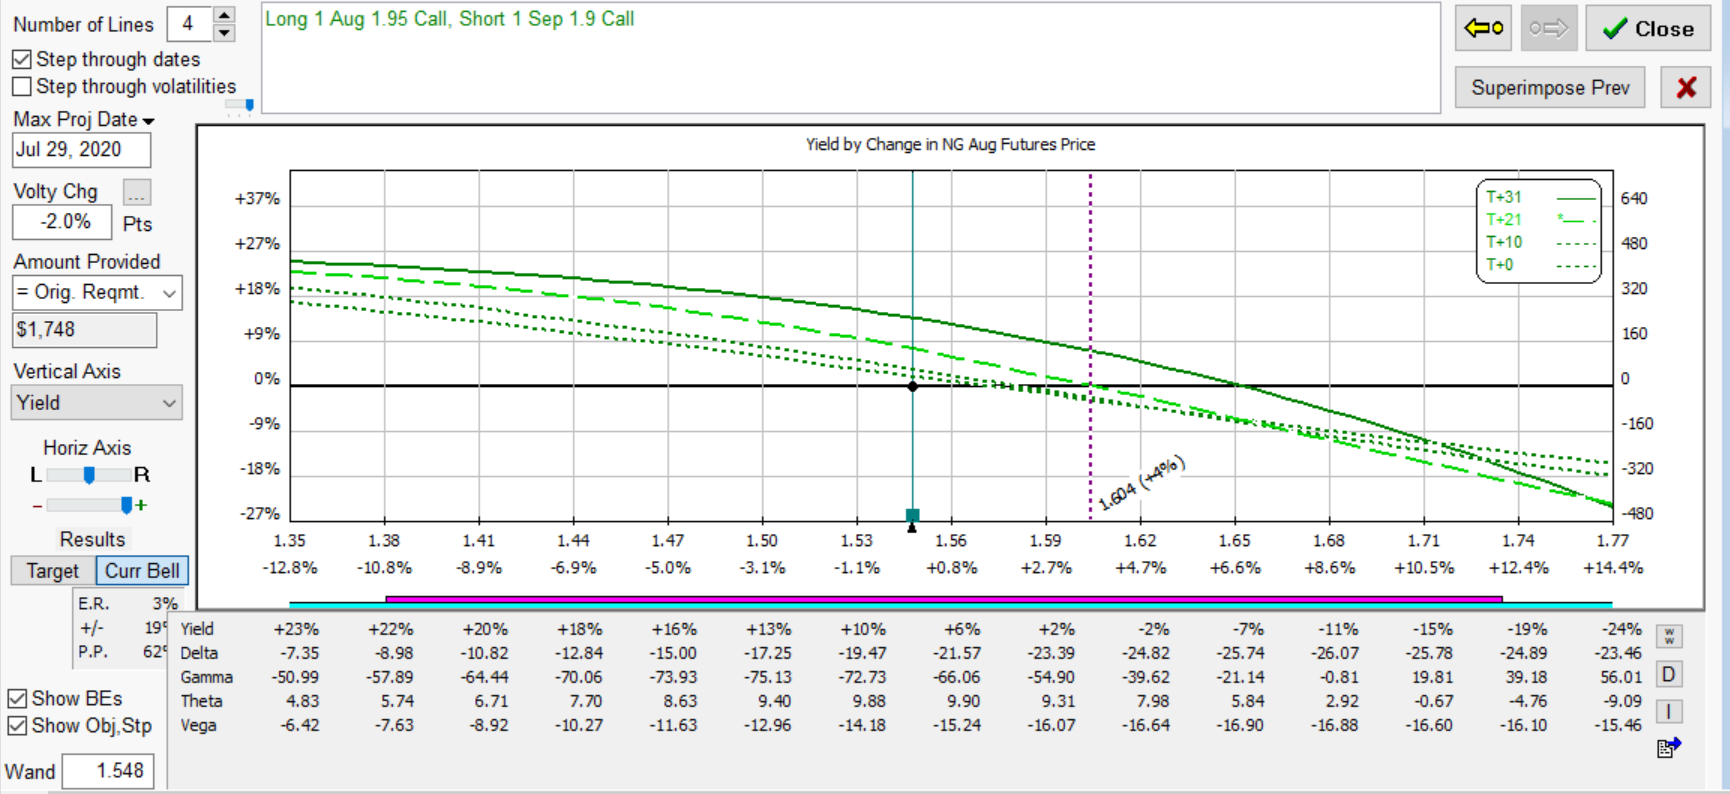
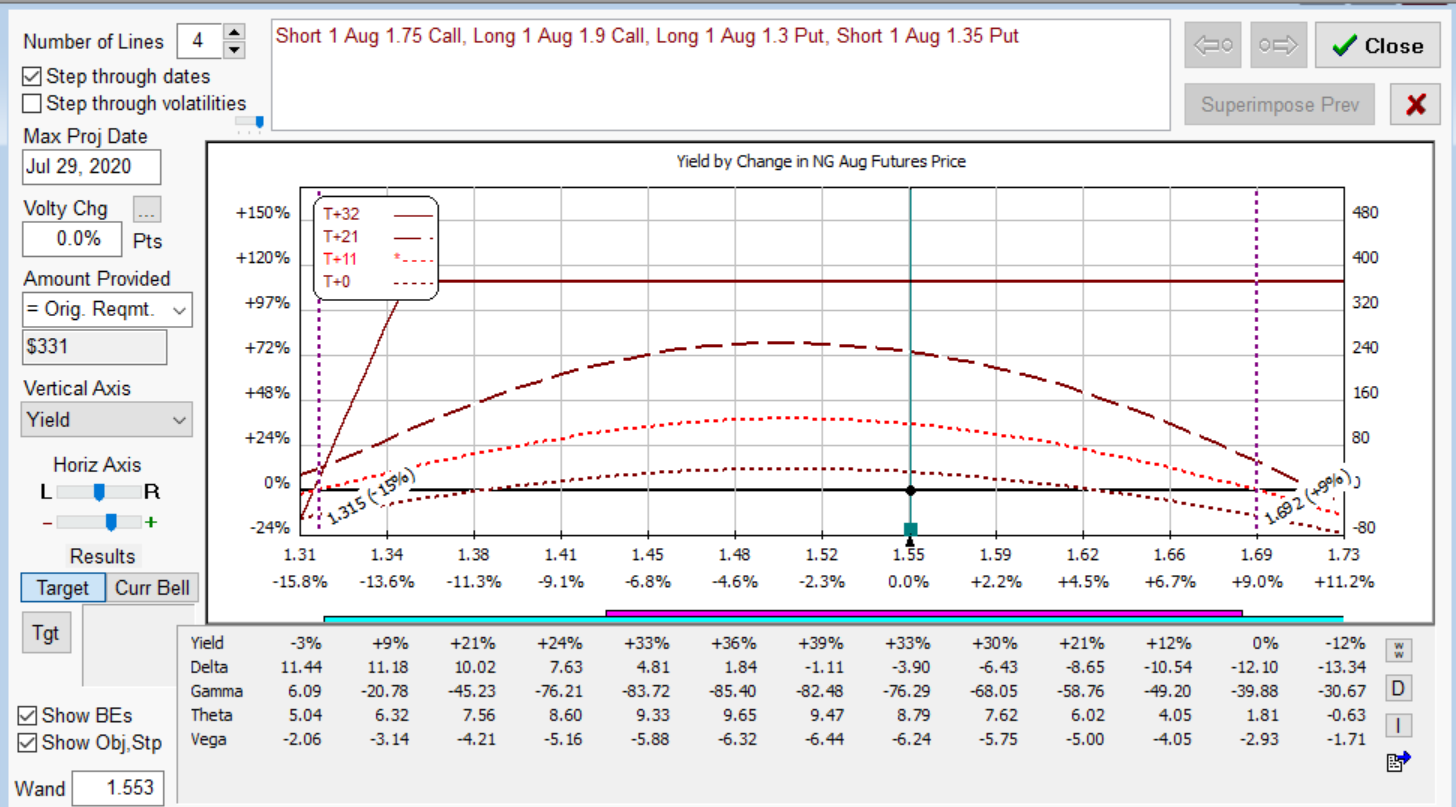
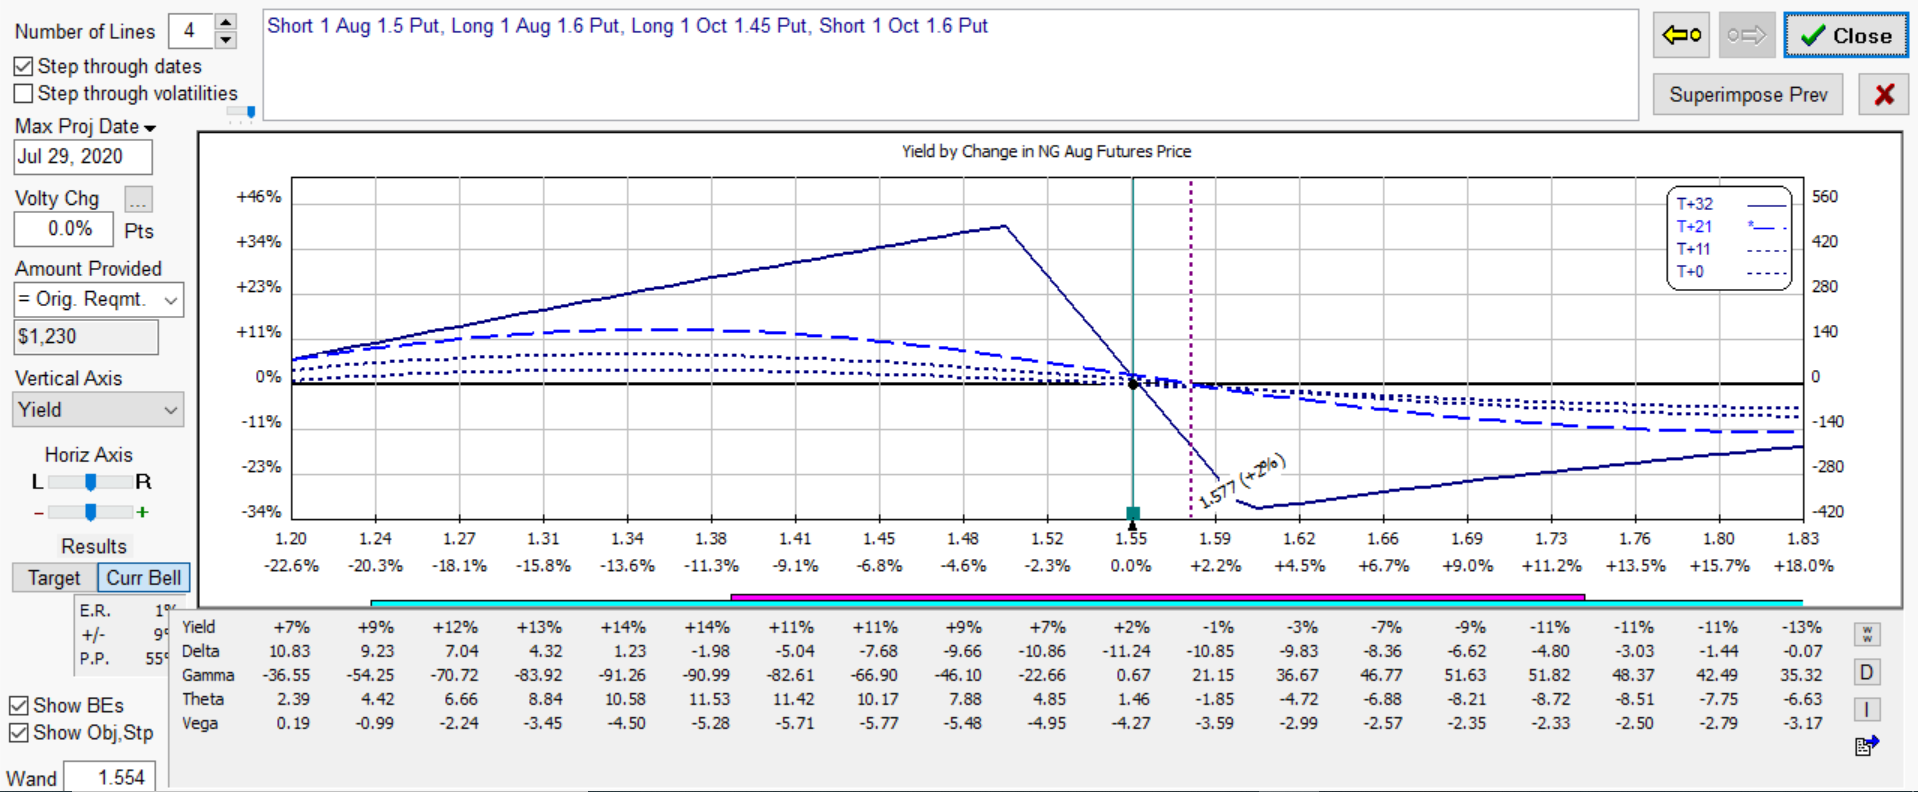
Below is an iron condor relatively delta neutral with estimated margin per 1 LOT. The illustration beneath is a calendarized version using put options with a slight directional bias bullish. Each has positive time decay where the iron condor will benefit slightly from a decline in implied volatility while the latter is opposite. Last is a butterfly using put options. Each would be impacted by changes in the April NG futures.
The % yield shown in the diagrams below represent an estimated return on margin from projected dates shown below. The structure has positive time decay which is an advantage over holding outright options.
Reverse Calendar
Iron Condor
Vertical Swap
Join our Free Webcast each month and learn how these strategies can benefit your trading.