Get a Free 30 day trial of MarketPlus Premium subscription when you get an hour consultation with Paul Forchione. MarketPlus Premium shows how we (Oahu) can use information to form actionable trade strategies.
Click here to learn about ACE
By using our website, you agree to accept our terms of use (click to read)
Terms of Use & Disclaimer:
Entries shown in our Watchlist and MarketPlus do not include commissions and are based on listed settlement prices for reference only.
This publication is intended solely for information purposes and is not to be construed, under any circumstances, by implication or otherwise, as an offer to sell or solicitation to buy or sell or trade in any commodities or securities herein named. Information is obtained from sources believed to be reliable, but is in no way guaranteed. No guarantee of any publication is construed as an express or implied promise, guarantee or implication by or from Oahu Capital Group, LLC, Oahu Capital Group (Asia) Pvt. Ltd. that you will profit or that losses can or will be limited in any manner whatsoever. Past results are no indication of future performance. All investments are subject to risk, which should be considered prior to making trading decisions.
CFTC regulation 4.41 requires the following disclaimer:
HYPOTHETICAL PERFORMANCE RESULTS HAVE MANY INHERENT LIMITATIONS, SOME OF WHICH ARE DESCRIBED BELOW. NO REPRESENTATION IS BEING MADE THAT ANY ACCOUNT WILL OR IS LIKELY TO ACHIEVE PROFITS OR LOSSES SIMILAR TO THOSE SHOWN. IN FACT , THERE ARE FREQUENTLY SHARP DIFFERENCES BETWEEN HYPOTHETICAL PERFORMANCE RESULTS AND THE ACTUAL RESULTS SUBSEQUENTLY ACHIEVED BY ANY PARTICULAR TRADING PROGRAM. ONE OF THE LIMITATIONS OF HYPOTHETICAL PERFORMANCES RESULTS IS THAT THEY ARE GENERALLY PREPARED WITH THE BENEFIT OF HINDSIGHT. IN ADDITION, HYPOTHETICAL TRADING DOES NOT INVOLVE FINANCIAL RISK AND NO HYPOTHETICAL TRADING RECORD CAN COMPLETELY ACCOUNT FOR THE IMPACT OF FINANCIAL RISK IN ACTUAL TRADING. FOR EXAMPLE, THE ABILITY TO WITHSTAND LOSSES OR TO ADHERE TO A PARTICULAR TRADING PROGRAM IN SPITE OF TRADING LOSSES ARE MATERIAL POINTS WHICH CAN ALSO ADVERSELY AFFECT ACTUAL TRADING RESULTS. THERE ARE NUMEROUS OTHER FACTORS RELATED TO THE MARKETS IN GENERAL OR TO THE IMPLEMENTATION OF ANY SPECIFIC TRADING PROGRAM WHICH CANNOT BE FULLY ACCOUNTED FOR IN THE PREPARATION OF HYPOTHETICAL PERFORMANCE RESULTS AND ALL OF WHICH CAN ADVERSELEY AFFECT ACTUAL TRADING RESULTS.
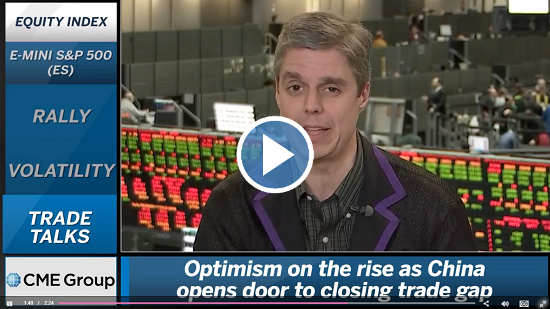
Click here to watch video
Commentary
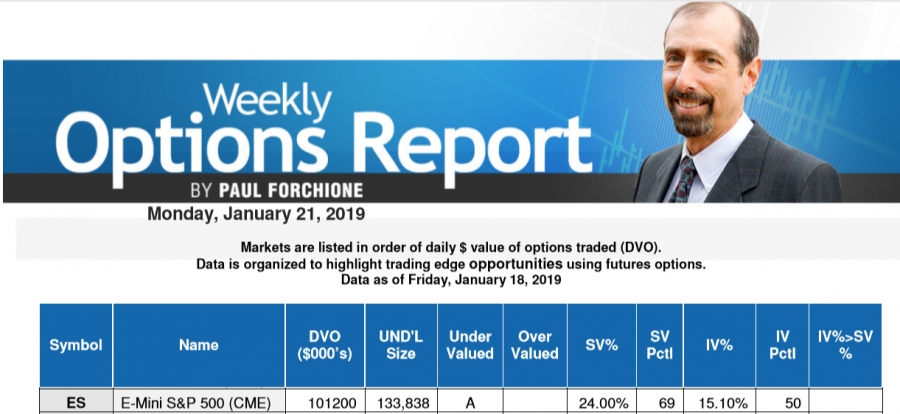
- Equity markets on the rise post holiday with highest weekly settle since Oct.
- Positive news out of China. Opens door to closing trade gap.
- VIX has its lowest weekly settle since October.
- Earnings are coming up with Davos conference, ECB meeting
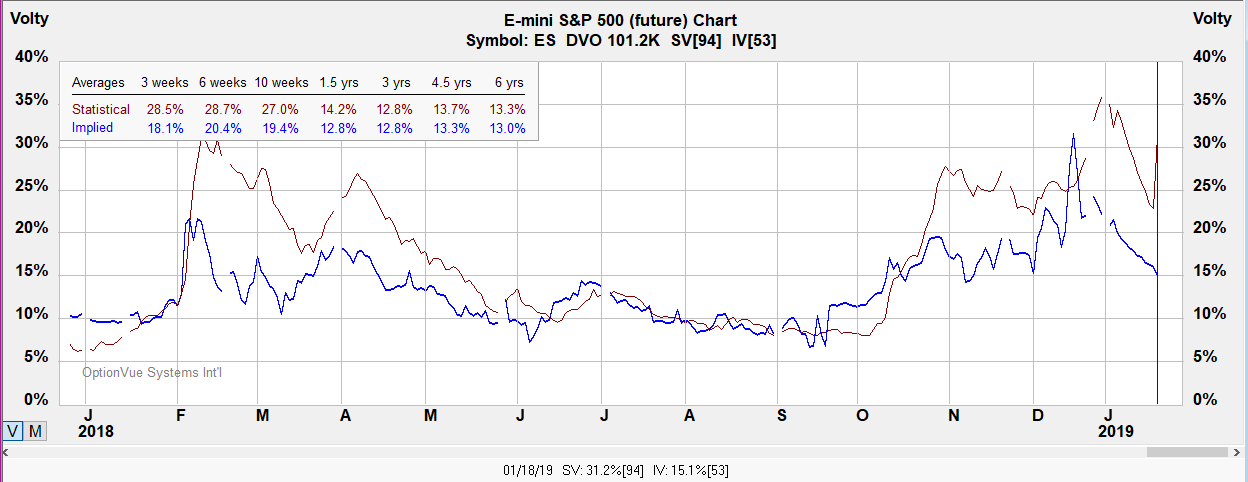
Volatility
It appears volatility has run down with the run up on markets with optimism.
Notes:
Contract Size - $50 x S&P 500 Index.
Tick Size: Outright: 0.25 index points=$12.50
Trading Hours: CME Globex: Sunday - Friday 6:00 p.m. - 5:00 p.m. Eastern Time (ET) with trading halt 4:15 p.m. - 4:30 p.m.
* Tip: Understanding what the numbers mean when looking at E-Mini S&P prices. The quotation you see is U.S. dollars and cents per 0.25 tick. Each contract you are buying or selling is is index price x 50. A 1 tick move is $12.50. Notional value of 2,432 = $121,600 USD.
?ml=1" class="modal_link" data-modal-class-name="no_title">* Tip: Click here to read a helpful tip about E-Mini S&P futures and options
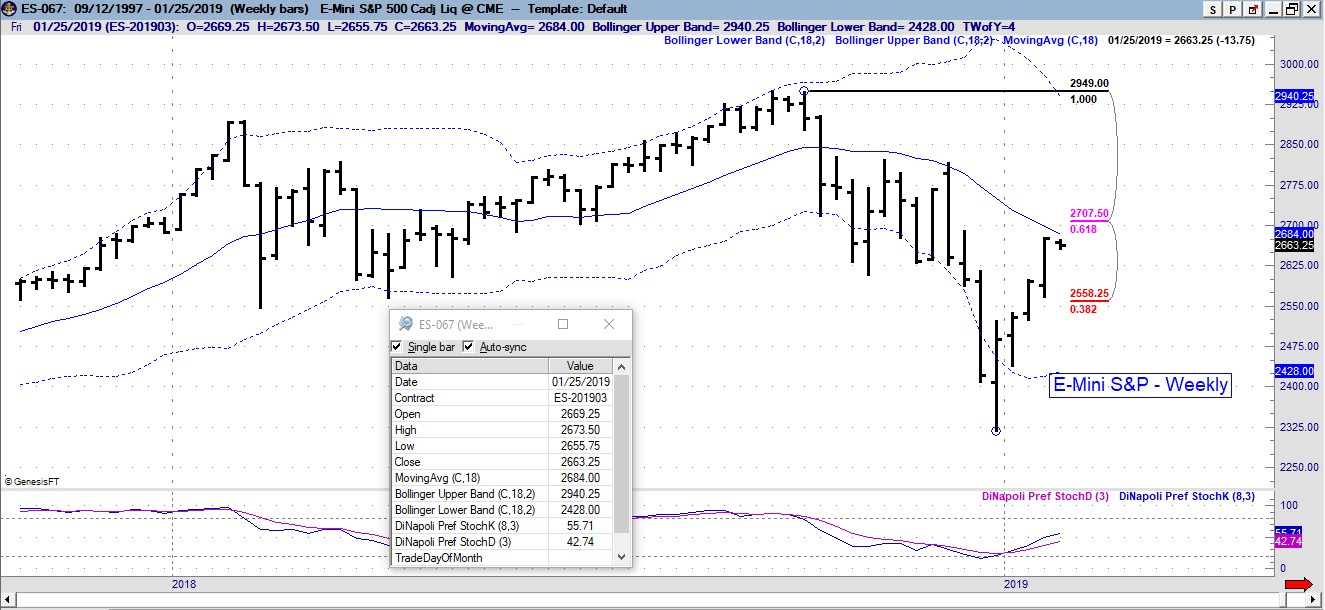
E-Mini S&P
Below is a weekly chart with widening of bands possibly indicating more volatility ahead if
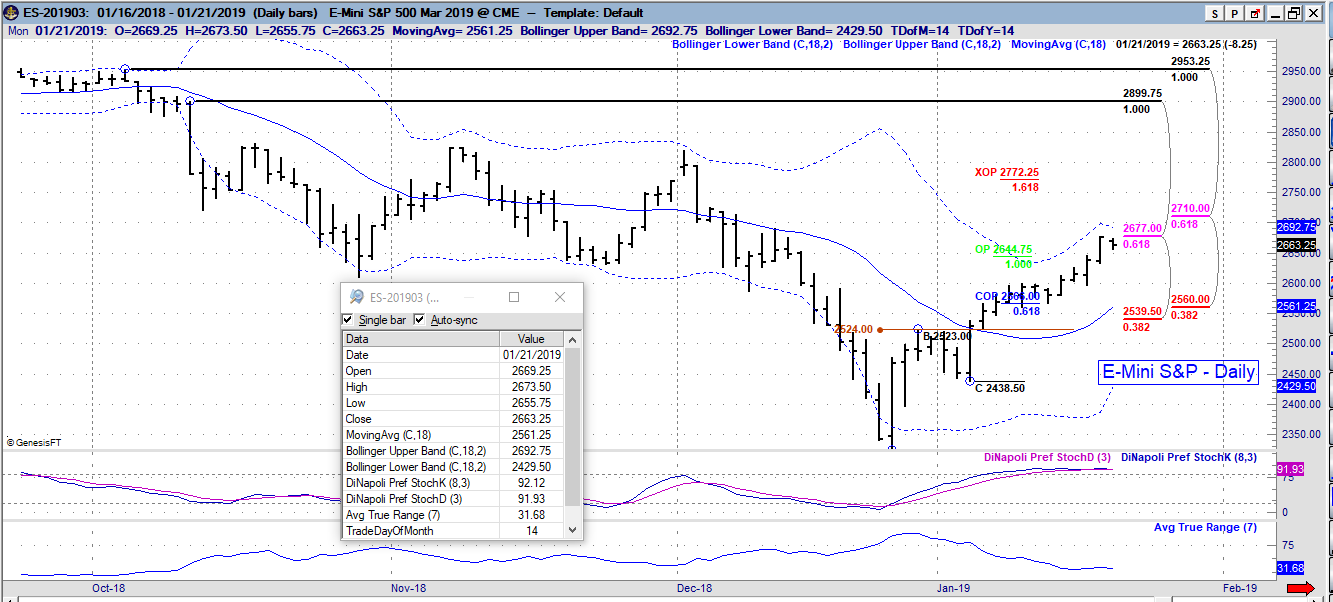
Below is a daily chart. Price broke above prior highs and although not shown, MACD has turned positive in tandem with Stochastics. Forecast technical resistance levels based on Fibonacci retracement and expansion levels coinciding above the 20 MA at center of Bollinger Bands.
* Tip: To view a larger chart image, simply right click on the image with your mouse. Next, select view image. Be sure to click the back arrow on your browser to go back to the original page.
?ml=1" class="modal_link" data-modal-class-name="no_title">* Tip: Click here on enlarging images
Strategies
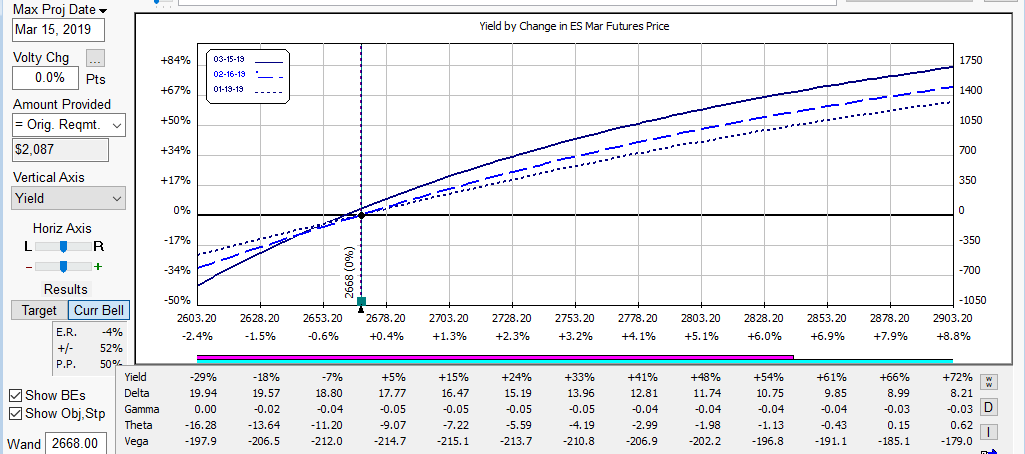
Below is an illustration of a bearish diagonal calendar to the downside if one's view were a further sell off to the downside. The structure has positive vega to take advantage of a hike in volatility. In the ACE Program education, we cover option strikes used.
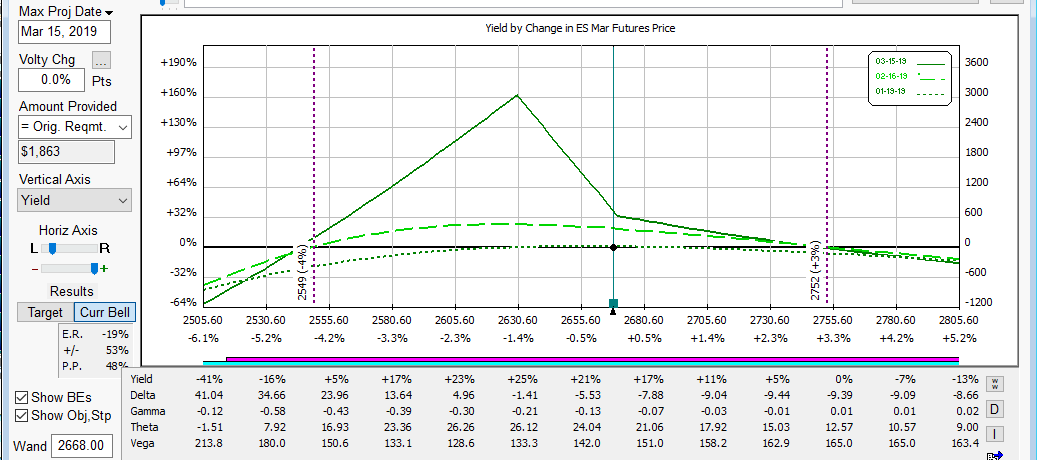
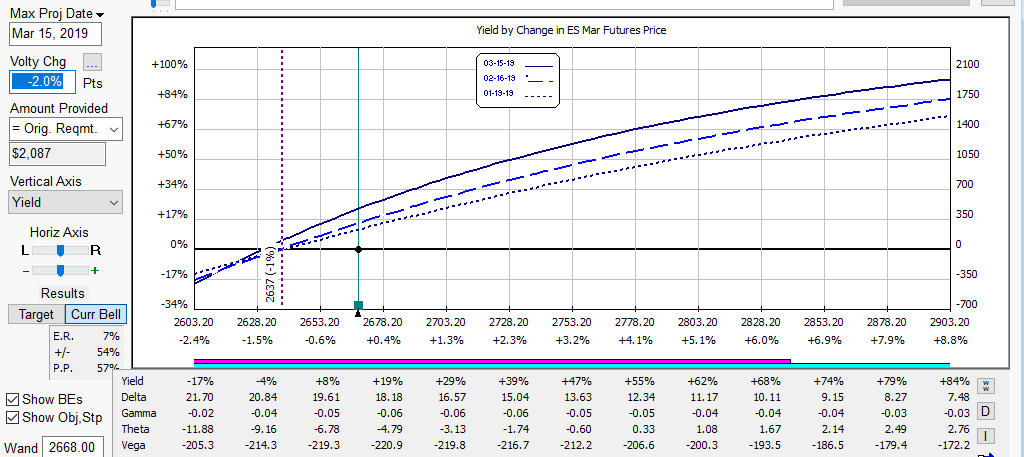
Below is a reverse calendar spread using puts if one's view were bullish for negative vega to the upside.
As prices move higher and implied volatility drops with optimism in the markets, there would be additional Vega on the position as modeled below.