ACE E-Mini S&P - Mar 17, 2019

Below is an illustration trading futures options on E-Mini S&P.  Our post shows bullish and bearish positions using a combination of call and put options.


Trade Options on Futures

E-Mini S&P * Directional & Neutral Positions

Get your copy of Paul Forchione's book, "Using Futures Options for Day Trading & Hedging" for $10 USD.  Learn techniques from a professional options trader to manage risk while speculating on futures markets.

eBook Cover Paul I


Click here to view Paul's eBook


By using our website, you agree to accept our terms of use (click to read)

cme es playbutton

Click here to watch video


Volatility

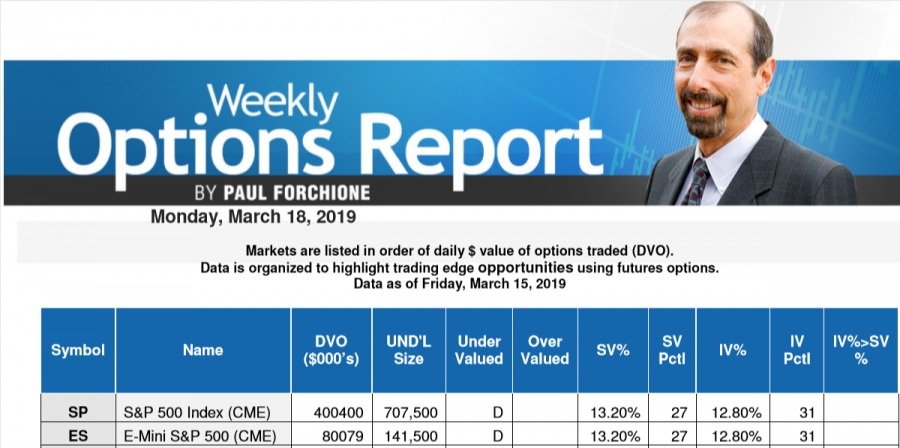
Options fall into the category of being slightly undervalued in non-volatile markets in the weekly options report. 
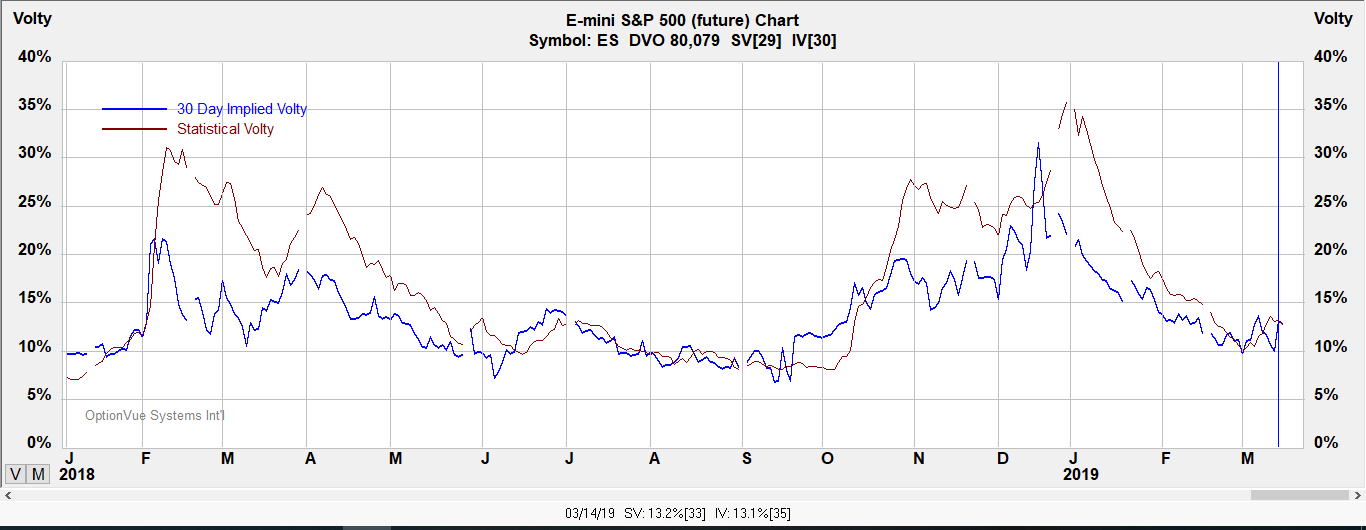
Ask about the Weekly Option's Report for more information or watch our video.

es vol


Notes:

Contract Size - $50 x S&P 500 Index.

Tick Size:  Outright: 0.25 index points=$12.50

Trading Hours: CME Globex: Sunday - Friday 6:00 p.m. - 5:00 p.m. Eastern Time (ET) with  trading halt 4:15 p.m. - 4:30 p.m.

* Tip: Understanding what the numbers mean when looking at E-Mini S&P prices. The quotation you see is U.S. dollars and cents per 0.25 tick. Each contract you are buying or selling is is index price x 50.  A 1 tick move is $12.50. Notional value of 2,432 = $121,600 USD.

?ml=1" class="modal_link" data-modal-class-name="no_title">* Tip: Click here to read a helpful tip about E-Mini S&P futures and options
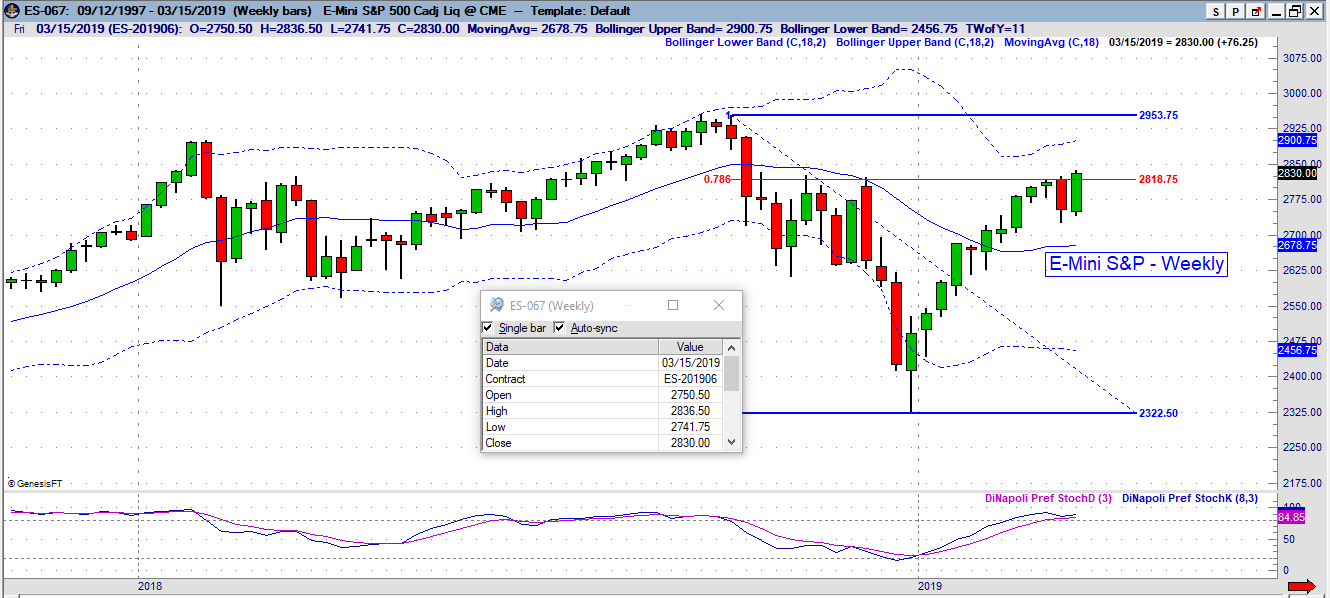

E-Mini S&P

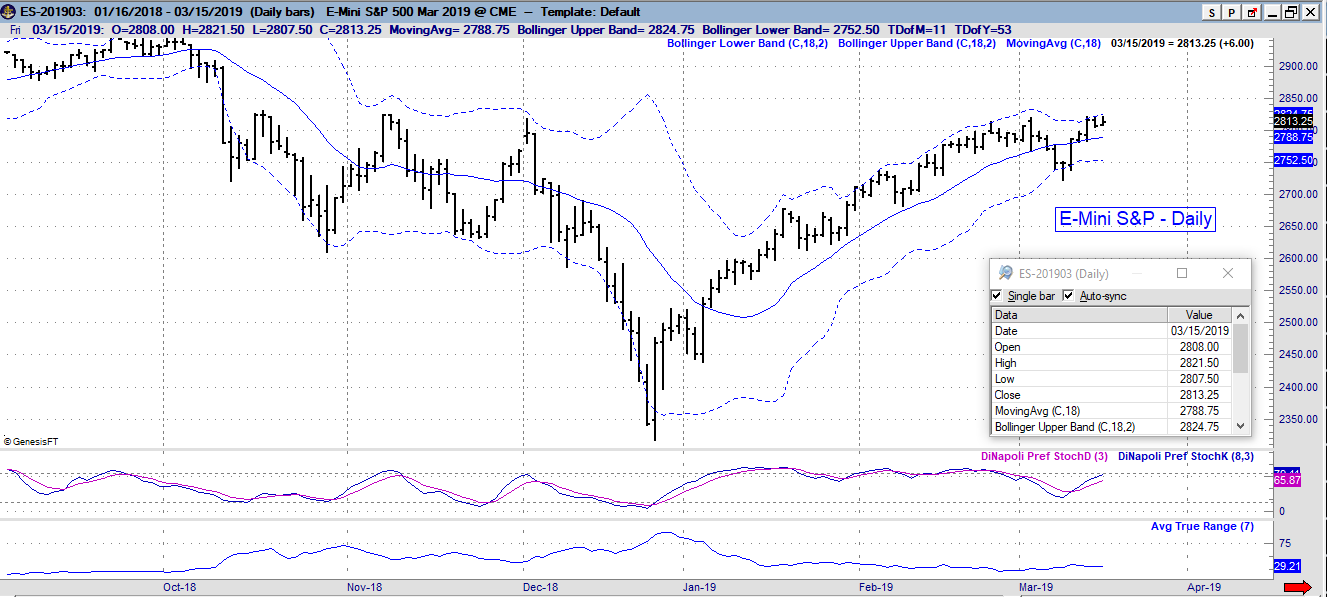
Below are both weekly and daily charts for reference.

TNG es weekly

Daily chart below.

TNG es daily

* Tip: To view a larger chart image, simply right click on the image with your mouse. Next, select view image. Be sure to click the back arrow on your browser to go back to the original page.

?ml=1" class="modal_link" data-modal-class-name="no_title">* Tip: Click here on enlarging images
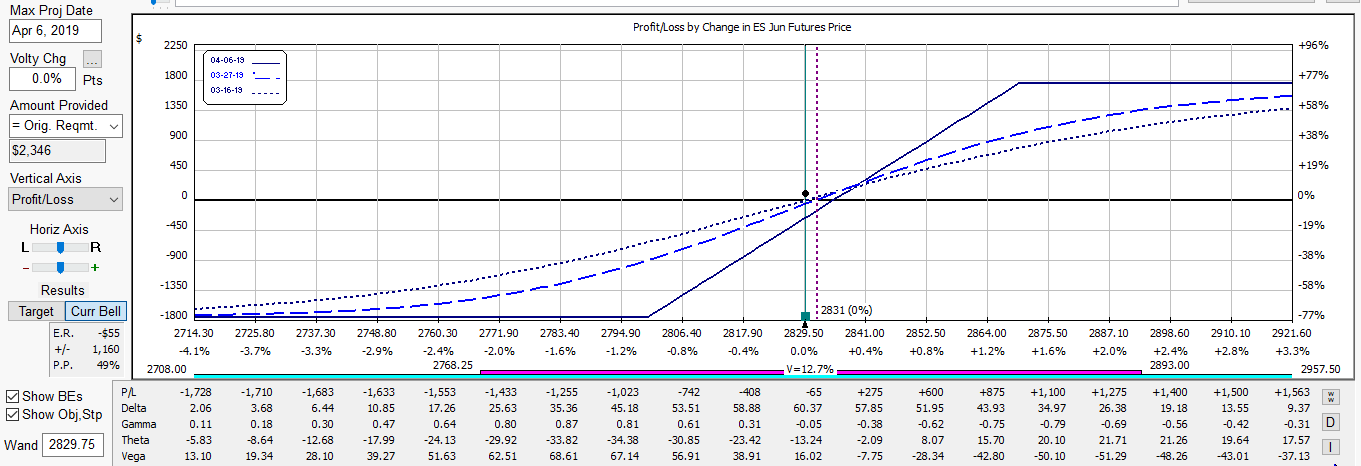
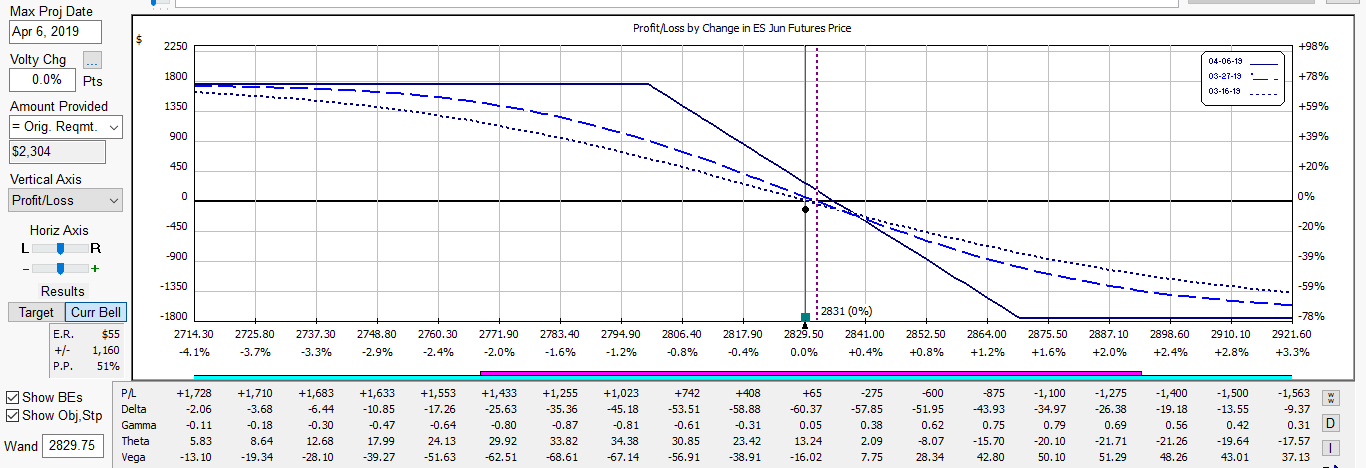
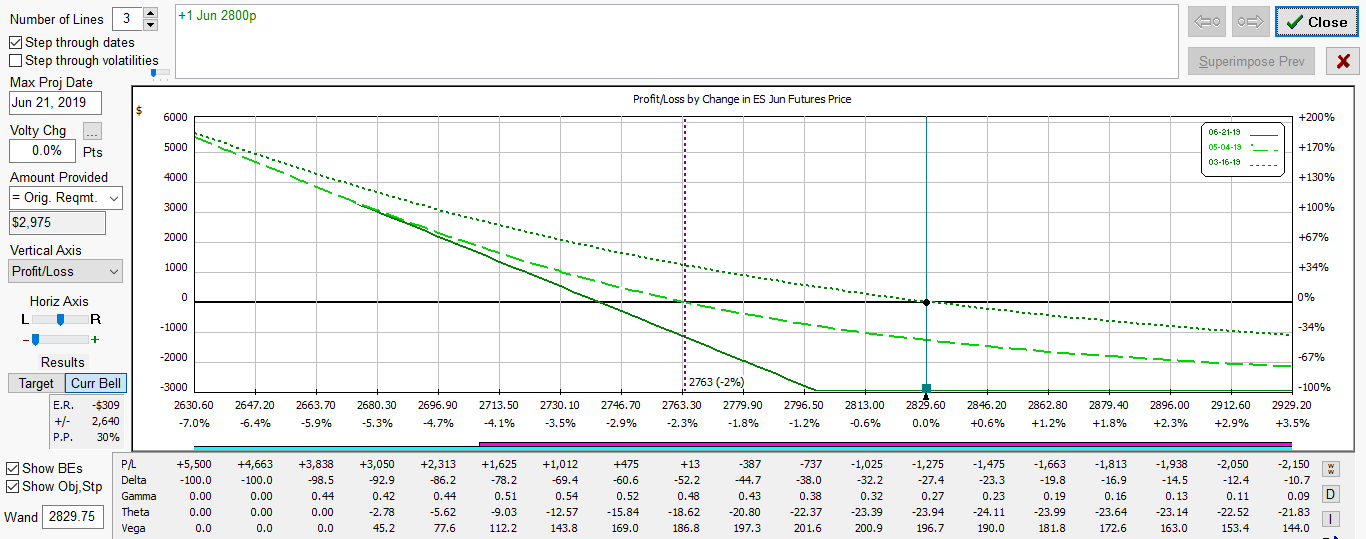
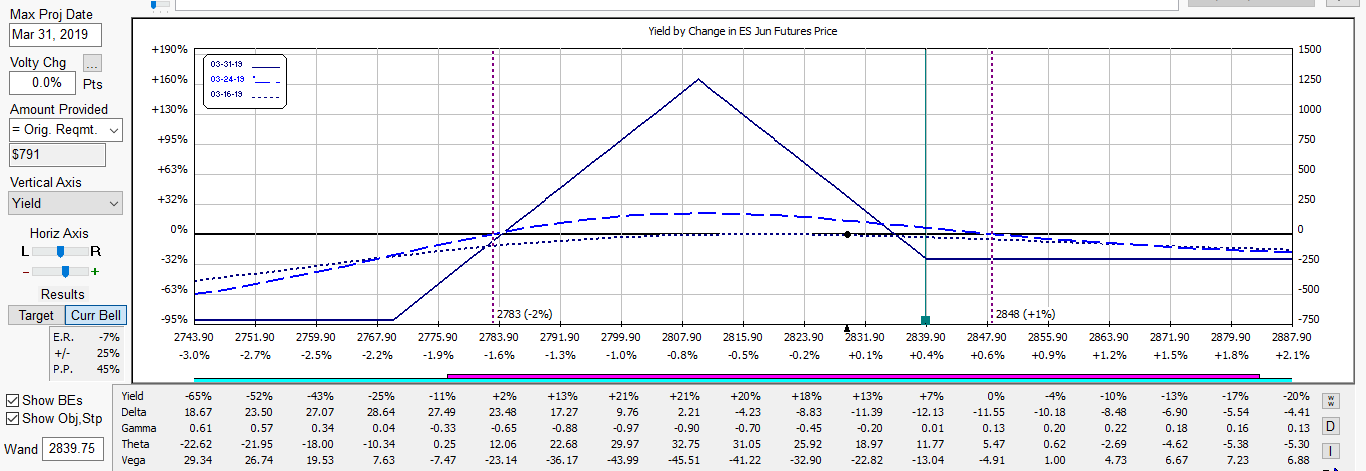
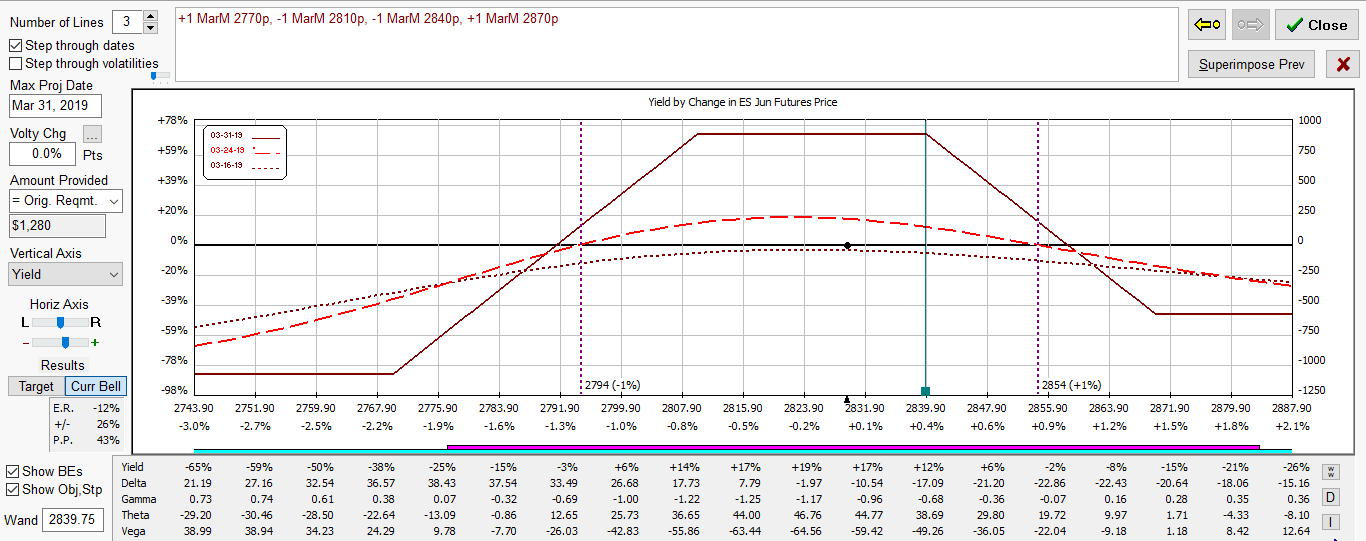

Strategies

Below are illustrations of vertical spreads based on a 1 lot using weekly options that expire in 12 days as of this post (Mar 29th). These are explained in Paul's 2nd book, "Intro to Advanced Option Spreads" with a section dedicated to trading weekly options.

es bullcall
 
es bearcall
 
Below is a volatility skew of the E-mini S&P.  
skew
 
For comparison purposes, I've included illustrations of simply purchasing a 2800 put option. 

put 1
 
Note the impact of time decay if market happens to be in the same area a week or so from now. 

put 3
 
Broken wing butterfly below. Notice theta is positive as compared to purchasing an outright put above.
 
1
 
Below is an illustration of a broken wing condor having a wider range.
 
2

For more information in learning how to create and manage futures options positions, please reference the ACEProgram or Paul's books in the "Resources" section of our website.